When determining how well your bank or credit union's website is performing, a number of factors need to be considered beyond visits alone. How long does a visiter spend on your site? Do they visit more than one page during a visit? How many pages do they visit? Is your website optimized for both smartphones and tablets?
In a just released report entitled, "
Best of the Best Benchmark",
Adobe examines six primary site performance metrics across five different industries to show the norms and areas of excellence. Even though supporting data provided by Adobe is rather sparse, financial marketers can still use these metrics as a guide to evaluate their website's performance and to provide impetus to make websites more powerful.
Time Spent on Website
Time spent on a website is probably the most important metric for determining site engagement. As could be expected, the amount of time spent on a top-performing financial institution website (6.77 minutes) is more than 5 minutes less than the time spent on an entertainment site (11.84 minutes) where content is robust. Interestingly, the variance between the best and the rest within the media and entertainment category is the largest, indicating that not all entertainment sites are . . . entertaining.
Adobe noted in their research that video is the most powerful content to use in social media because of the engagement value. While banks are just beginning to add video as part of their website experience, custom product and service videos could definitely increase engagement for financial firms (I covered the power of video in my February 27 post entitled, "
Improving Bank Onboarding, Cross-Selling and Retention With Personalized Video").
 |
| Source: Adobe, "Best of the Best Benchmark", March 2013 |
Website Stickiness
Defined as the percentage of visits that result in more than one page view, the best performing financial service sites do well in the measurement of stickiness (72% of visitors visit more than one page), while on average banks and credit unions fall to the lower end of industries evaluated.
While on the surface, this measurement may provide bank and credit union marketers an indication that they are drawing the right audience (there is a low bounce rate), it could also reflect that many visitors to financial sites start their visit on the less targeted home page as opposed to a page more reflective of the visitor's shopping interest. Therefore, a higher stickiness measurement may identify design and search marketing improvement opportunities for banks, where a visitor can enter the site on a page more relevant to their search. This could redirect spending and assist in targeting efforts.
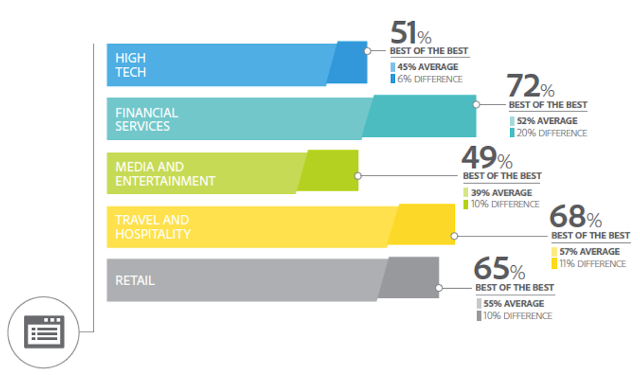 |
| Source: Adobe, "Best of the Best Benchmark", March 2013 |
Page Visits
While page visits, in general, are a good indicator of engagement, this measurement has the potential drawback of the two metrics mentioned above, since a high page visit value could indicate a poorly designed website where a visitor has a difficult time finding what they want on a site. The key is to evaluate page visits in conjunction with conversion rates to ensure that the power of more page views (or time on the website) correlates to more sales.
The evaluation of page views is especially important in financial services, where increased page views does not equate to more ad revenue opportunities as it does with many media and entertainment sites. Interestingly, as was the case for the metric of website stickiness, the best of the financial sites performed near the top of the industries evaluated, while the average bank and credit union website fell near the bottom of the pack.
 |
| Source: Adobe, "Best of the Best Benchmark", March 2013 |
Smartphone Visits
With banks focusing more and more on the mobile user and with smartphone users spending more time with email, search and social media, the importance of an optimized mobile experience can't be overemphasized. In fact, with recent studies indicating that the majority of consumers begin their shopping for financial services online, the value of capturing the smartphone user is greater than ever. Bottom line, if you don't provide an easy and relevant site experience (optimized for mobile), your prospective customer may never return.
Unfortunately, according to Adobe, the financial services industry falls well short of other industries, with only 9.7% of the internet traffic for the top performing firms coming from smartphone users and a paltry 7.2% being the average performance for banks and credit unions. While it could be argued that smartphone users are less likely to search for a financial firm using their phone (as opposed to a tablet or desktop), there is still much room for improvement given the importance of the younger, social media savvy consumer.
A way for banks to improve performance in this category is through the better use of imbedded links in email and digital communication that is accessed via the mobile device. While many banks still do not use email or digital marketing effectively, smartphone users are avid browsers and tend to open the majority of their emails on the go.
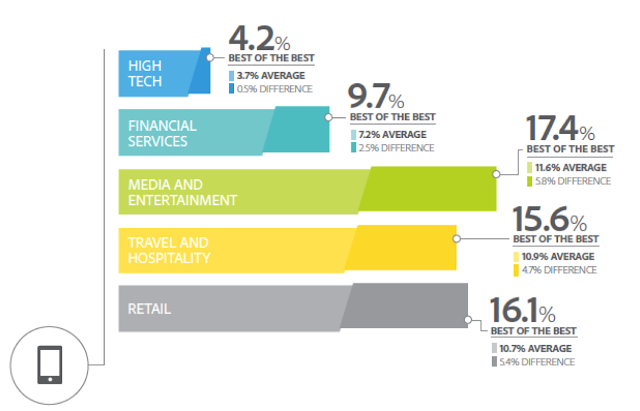 |
| Source: Adobe, "Best of the Best Benchmark", March 2013 |
Tablet Visits
While the disparity between the best and the average performance of financial services firms in terms of tablet traffic was less than any other measurement, the percentage of traffic coming from the highly sought after tablet user was only 5.4% for the best bank or credit union site (4.5% average). This should be disconcerting to bank and credit union marketers since tablet users are some of the most affluent consumers, and therefore, an excellent target audience for financial services.
And while it can be argued that people would rather do retail shopping or dream about their next vacation on their tablet, this measurement is a percentage of overall web traffic, indicating that banks and other financial firms still lag on this important measure.
Possibly reflected in the numbers, most financial services firms have not spent adequate resources on their tablet applications and have not developed the rich media experiences that tablet users desire. This opportunity was discussed in the just released research conducted by
Fiserv entitled, "
Banking on the Tablet Channel." As mentioned in the study, delivering an app-driven, fully functional tablet experience that compliments all channels will lead to more customers.
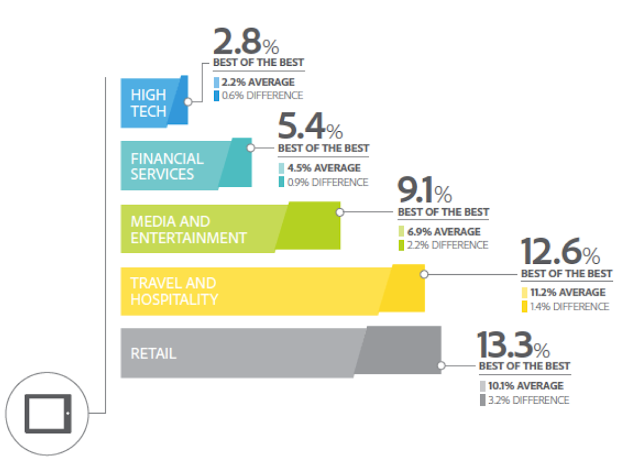 |
| Source: Adobe, "Best of the Best Benchmark", March 2013 |
Room For Improvement
While there are many ways to measure the performance of a financial services organization web site, it is clear that most bank marketers need to work with their website development team to improve the user experience and create a better selling platform. This platform must have a responsive design that is optimized for the mobile and tablet user and contain engaging content that captivates the visitor and ultimately results in either a product sale or deeper engagement.
Another source of website performance rankings used in the financial services industry besides the Adobe study reviewed here is the
Gomez Banking Performance Index. Gomez uses nine website metrics and 12 mobile metrics to provide insight into how customers and prospects experience a financial services site. While many of these measures compare speed, availability, etc., they are still important when determining performance.
Additional Resources