Wednesday, September 30, 2009

Overview Of The Google Analytics Platform And API


In the previous two videos from the API team, tech lead Jacob Matthews discussed What Is the Google Analytics API and Steps To Using the Google Analytics API.

In our third video, we turn to Ruth Doane, another Tech Lead, to take a step back and look under the hood of Google Analytics itself. Did you ever wonder how data is collected and organized in Google Analytics? See what happens to traffic data after it is sent to Google Analytics and learn how it gets processed and stored, and then ends up in the Web Interface and Custom Reporting.

And best of all, learn how the API works with your data, and how it puts you are in the driver seat. Enjoy!

Announcing View-through conversion reporting on the Google Content Network

Earlier this year, we mentioned our plans to improve the measurement of conversions for display advertising campaigns on the Google Content Network. Today, to help you better measure the value of your display advertising campaigns, we're announcing a new feature called View-through conversion reporting on the Google Content Network.

Display ads are influential in increasing brand awareness and driving purchase consideration, and with View-through conversion reporting, you can better measure the impact of your display ad campaign for those instances where your ad is seen, but not immediately clicked on. More specifically, View-through conversion reporting measures the number of conversions that occurred within 30 days of your display ad appearing for which there was no ad click generated.

By using View-through conversion reporting, you can more easily compare the performance of your Google Content Network campaign with the performance of your other display advertising campaigns. This feature can also help you determine the best ways and places to advertise, how best to optimize your display ad campaigns, and, ultimately, how to spend your advertising dollars more effectively.

Here is an example of how View-through conversion reporting works: Let's say you're selling pet food online and you're measuring conversions on your site's email newsletter sign-up and your shopping cart "Thank You" pages. If a user sees your display ad, does not click on it but then visits your site within the next 30 days to sign-up to receive your email newsletter and to purchase a couple dozen cans of organic cat food, you'll see two View-through conversions reported on your Campaigns tab in AdWords.

Starting today, you can also visit the Campaigns tab in AdWords and activate the optional View-through conversion reporting column. You'll need to have AdWords Conversion Tracking installed for View-through conversion reporting to work for your campaigns.

To learn more about View-through conversion reporting on the Google Content Network, you can visit the Help Center. We hope this feature will provide you with better information about your campaigns and help you get the most out of your display advertising campaigns.

New Seminars for Success locations

If you're looking for some help with your online advertising for Q4 or 2010, consider attending one of our in-person full-day seminars about AdWords, Analytics or Website Optimizer.

In the coming months we'll be offering Seminars for Success in the following cities:

AdWords 101: Beginner and 201: Intermediate
October 5-6:
New York City Area
October 26-27:
Chicago, IL
November 2-3:
Berkeley, CA
November 16-17:
Charlotte, NC
December 7-8: Scottsdale, AZ

Adwords 301:Advanced Account Optimization and AdWords 302: Advanced Conversion Optimization
October 13-14:
Dallax, TX
October 20-21:
Seattle, WA
November 3-4:
Los Angeles, CA

Analytics: Introduction and Analytics: Advanced
October 8-9:
New York City, NY
October 22-23:
Melbourne, Australia
October 28-29:
Chicago, IL
November 4-5:
Berkeley, CA
November 18-19:
Seattle, WA
December 9-10:
Scottsdale, AZ
December 9-10:
Charlotte, NC

Website Optimizer
October 30:
Chicago, IL
December 11:
Scottsdale, AZ

For more information about Seminars for Success, including registration details, course outlines, and past attendees' comments, please visit
http://www.google.com/awseminars

Dare to be DiFfErEnT

In this image ... what catches your attention?

Go to any of your branches. My bet is that if you walk 5-10 minutes in any direction, you're likely to find at least one other bank or credit union.

There are nearly 20,000 individual banks and credit unions in the US - most with multiple branches. When most all financial institutions offer free checking, debit card, retail loans and savings, how do you stand out to get consumers attention?
  • Do something fun and unique at every transaction
  • Package or bundle your "usual"products in a way that shows you understand the consumer's needs
  • Train your staff to do something that truly helps the customer save money
  • LISTEN to what the customer says, HEAR the needs, and consultive sell a product to help them
  • Make your branch look more like a retail store than a bank
  • Jazz up your website - focus on what a consumer would be looking for and less on your products
  • Become known for something fun ... anything fun
  • Write personal notes to customers
  • Replace suckers with popsicles
Most of all, look at what your competitors do and do everything better.

This year more than any other, consumers have been switching banks. There is "Money in Motion" in your community. The zebra among horses will gain the market share.

Take are,
Eric

Tuesday, September 29, 2009

Advanced: Structure Your Account With Roll Up Reporting And More

Guest post by the team at E-Nor, a Google Analytics Authorized Consultant

For the analytics ninjas out there, you know that data accuracy is probably one of the most challenging aspects of analytics across all solutions and platforms, and you learn to apply best practices and establish processes to improve data collection and reporting.

But for the rest of us, how do we help marketers, business owners, and webmasters have confidence in their data? Analytics is all about clarity. It should help you see actionable statistics clearly and quickly. However, when you have a website structure with multiple domains and subdomains - which is often the case - sometimes things can get jumbled.

For instance, you are a CMO or a Director of Marketing at the enterprise and you are responsible for the performance and ROI of a large number of web proprieties. You look at your analytics reports and you can't find your ecommerce data from site A, site B is referring traffic to itself (definitely not a good thing!), and conversion data from your marketing campaign microsite is no where to be found.

This image sums up the feeling.

No need to panic. This post aims to offer an approach to help you plan your Google Analytics accounts setup in a structured fashion to help with clarity. I hope that by following the approach and the technical steps, you will be able to collect and manage all your data, make more sense of it, and most importantly, ensure what you are reporting on, trending, dashboarding and analyzing is based on accurate data.

There are two distinct sections of this post:

  • The Strategy (non-technical)
  • The How (technical)

The Strategy

There are many ways to structure your Google Analytics profiles when you have multiple domains and subdomains. But in this post I will limit myself to the one that I like the most and I believe is the least confusing.

Before I go into details of the solution, and for simplification, let us assume we are dealing with a pr
oject that has the following requirements:
  • A business with 3 domains (www.a.com, www.b.com, and www.c.com)

  • 1 domain (a.com) links to a 3rd party shopping cart (www.mystore.com)

  • 2 domains (a.com and b.com) have multiple sub-domains

Here is a graphical representation of the structure:

Measurement Requirements
  • Track each domain and sub-domain separately (e.g. www.a.com, news.a.com, and blog.b.com)

  • Track the rollup/overall traffic for all domains and sub-domains

  • Track full e-commerce transactions

Solution
  • Create a Google Analytics account for each domain (www.a.com, www.b.com, and www.c.com)

  • Customize the tracking code to link the multiple sub-domains with their main domains

  • Link the third party shopping cart with the main domain and install Google Analytics tracking code in all shopping pages

  • Create a rollup Google Analytics account and add its code to all domains and sub-domains
Graphical example of a well-planned Analytics Account Structure:

Now on to the technical stuff. If you don't enjoy javascript and regular expressions, you may stop here and ask your webmaster or technical analyst to read further :-)


The How:

I will try to illustrate the technical implementation in 10 simple steps:

1- Create a unique Google Analytics account for each domain www.a.com, www.b.com, and www.c.com and then use the account number UA-AAAAAAAA-1 in the code in step 3 and use the accounts UA-BBBBBBBB-1 for www.b.com and UA-CCCCCCCC-1 for www.c.com in the code in step 8.

2- Create a Google Analytics account for the a rollup account that will oversee all domains and sub-domains (use the GA account number UA-XXXXXXXX-1 in the code used in step 3 and 8)

3- Add the following Google Analytics tracking code to the main site (www.a.com) and its sub-domains (blog.a.com, news.a.com, images.a.com, and media.a.com)

About the following code: We have a regular pageTracker object to track activity on each particular subdomain and a rollupTracker to track activity across all subdomains and the third party checkout site. (Click here to learn more about the customizations we made to the standard Google Analytics tracking code)

<script type="text/javascript">
var gaJsHost = (("https:" == document.location.protocol) ? "https://ssl." : "http://www.");
document.write(unescape("%3Cscript src='" + gaJsHost + "google-analytics.com/ga.js' type='text/javascript'%3E%3C/script%3E"));
</script>
<script type="text/javascript">
try {
var pageTracker = _gat._getTracker("UA-AAAAAAAA-1");
pageTracker._setAllowHash(false);
pageTracker._setDomainName(".a.com");
pageTracker._setAllowLinker(true);
pageTracker._trackPageview();
var rollupTracker = _gat._getTracker("UA-XXXXXXXX-1");
rollupTracker._setAllowHash(false);
rollupTracker._setDomainName(".a.com");
rollupTracker._setAllowLinker(true);
rollupTracker._trackPageview();
}
catch(err) {}

</script>

4- Enable E-Commerce Reporting

Analytics Settings > Profile Settings > Edit Profile Information

5- Add the following code* to all shopping cart pages on the store site (www.mystore.com)

*Make sure to add this code to the top of the pages.

<script type="text/javascript">
var gaJsHost = (("https:" == document.location.protocol) ? "https://ssl." : "http://www.");
document.write(unescape("%3Cscript src='" + gaJsHost + "google-analytics.com/ga.js' type='text/javascript'%3E%3C/script%3E"));
</script>
<script type="text/javascript">
try {
var pageTracker = _gat._getTracker("UA-AAAAAAAA-1");
pageTracker._setDomainName("none");
pageTracker._setAllowLinker(true);
pageTracker._trackPageview();
var rollupTracker = _gat._getTracker("UA-XXXXXXXX-1");
rollupTracker._setDomainName("none");
rollupTracker._setAllowLinker(true);
rollupTracker._trackPageview();
}
catch(err) {}

</script>

6- Add the e-commerce tracking code to the confirmation page after the GATC.

Read more about "How to track e-commerce transactions?"

7- Change the links to the store site (www.mystore.com) on the main site (www.a.com) to use _link as following:

If the current link looks like:

<a href="https://www.mystore.com">Buy Now</a>

Change it to:

<a href="https://www.mystore.com" onclick="pageTracker._link(this.href); return false;">Buy Now</a>

8- Repeat step number 3 for domains www.b.com and www.c.com after updating the Google Analytics account number UA-AAAAAAAA-1 and the setDomainName value.

  • To view the entire code for www.b.com and its sub-domains (click here)

  • To view the entire code for www.c.com (click here)

9- Create a profile for each sub-domain (only if needed)

In order to track a sub-domain (ex. blog.b.com) in its own profile, follow the following three steps:

a- Create a filter that include only traffic from Hostname=blog.b.com


b- Create a profile and name it "Blog"

c- Apply the sub-domain filter to the new profile

10-
As you might have noticed from the codes that we added so far to all pages, we added an extra Google Analytics account to track all pageviews across domains and sub-domains to one Google Analytics account. We call this account “rollup account”.

var rollupTracker = _gat._getTracker("UA-XXXXXXXX-1");
rollupTracker._trackPageview();

Since in the rollup account, we will track pages from different sites and many of these pages might share the same naming convention, I suggest that you create an advanced filter that adds the hostname to the page name to differentiate between pages with same URI.

Once you apply the filter, the upcoming data will appear as following:


Note, in the example above if we didn’t apply the “Add Hostnames” filter, all home.aspx pages will appear as one page with 2685 pageviews.

If you have been with us so far, you are now ready to conduct your analysis based on clean and much more accurate data :)
  • To review each domain by itself and for deep-dive analysis, use the domain profiles

  • To get an overview and to see how the business is doing across all sites, use the “Rollup Account”

Related Posts


Monday, September 28, 2009

Welcome to our Think2010 Series


In a mere few days, the 4th quarter will be upon us. Seems like just yesterday we were running our Do More with Less series to arm you with tools and tactics to show the 2009 recession who's boss.

As we start wrapping up 2009 and start thinking about what 2010 might hold, we're feeling optimistic. We're hoping we can transition from being your partner through the recession to being your partner through a recovery. That's why we're launching the Think2010: Getting Ahead of the Recovery series. For the next few months, we'll be devoting a weekly post to looking forward. The series will highlight wisdom from Googlers and outsiders alike, and offer opportunities for deeper learning. Over the course of the series you'll see posts on innovation, experimentation, speed, and deeper customer connections -- themes we believe will be critical to 2010 success.

In 2010 you'll likely have products to promote, news to share, and promotions to tout, so you'll need a targeting strategy that is as effective as those messages you have to get out the door. Precision and relevance will be as important as ever as you aim to (re)connect with customers and direct them your way. That's why we're focusing our first webinar of our Think 2010 series precisely on this topic.

Next Tuesday, Oct 6th, we'll be hosting a Think2010 webinar on “Using Data to Better Connect with Your Customers." If you haven't registered, take a look! Our very own Avinash Kaushik will set you out on the right foot for really (truly) making data actionable for decision-making next year -- and right now. He'll discuss core data sources to have in your 2010 targeting toolkit and show you how to capitalize on these tools for refining your targeting approach and honing in on your most relevant and valuable audiences. The webinar will also highlight how free tools like Google Trends for Websites, Insights for Search, and Ad Planner can help you be more efficient and help you confidently make decisions to maximize your return-on-investment.

As you scope your strategy and tailor your tactics for next year, we hope the Think2010: Getting Ahead of the Recovery series will be a good resource to help you charge ahead feeling informed and inspired.

Back to Basics: What's in a profile setting?

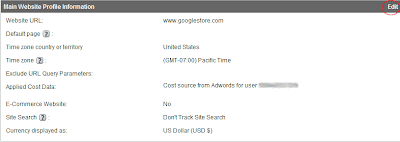
A little known link in your Analytics account is the key to unlocking extra ecommerce functionality in your Google Analytics account. In this post, we'll show you how clicking the 'Edit' link in your Main Website Profile Information box can open doors for your AdWords and ecommerce tracking purposes.


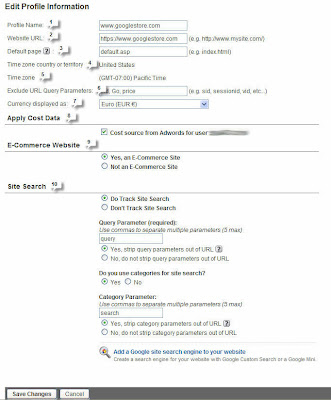
Once you click 'Edit' (highlighted in red above), you'll see a screen with editable fields like the image pictured below. The numbered list corresponds to the number next to each field so that you can learn how to set up a profile and enable the right features for your tracking purposes.


  1. Enter an easily identifiable profile name.
  2. Fill in the web property URL that you are tracking for this profile.
  3. Enter the default page to which your server defaults to when no page on the domain is specified. This information allows Google Analytics to combine requests to www.yourdomain.com and www.yourdomain.com/index.html, which are in fact the same page. If Default page isn't specified, these would be reported as two separate pages.
  4. If your account is linked to an AdWords account, your time zone country and time zone will default to the ones specified in your AdWords account. If your accounts are not linked, you'll see pull-down menus that display options for you to select for #4 and #5.
  5. Same as #4.
  6. If your site uses unique session IDs or other query parameters in your URLs that you are not interested in seeing in your reports, you can easily exclude these parameters by entering them into this field.
  7. Enter the currency you want to see in your reports.
  8. If you have linked an AdWords account, import your cost data so that you can get AdWords information pumped into your Google Analytics account. Once your cost data is imported, the information will appear in the Clicks tab of your AdWords report. Learn how to import your cost data.
  9. If you're tracking e-commerce on your website, you must enable it to be reflected in your reports in this section. If you would like to set up e-commerce for your site, please read this Help Center article.
  10. If you have a search engine on your site, you may want to enable this feature. Site Search contains reports about the visitors using the 'search' functionality on your website. Google Analytics Site Search reports deliver many useful pieces of information - for example, they can help you analyze how people use the search functionality on your site, and report its conversion metrics. Learn how to enable Site Search.

Friday, September 25, 2009

"Alignment" Woes

Greetings on a Friday afternoon! I was thinking about being a bank marketer today; remembering all the ups and downs, the joys and the fun and the frustrations as well. My biggest frustration when I sat in the marketing director's chair for a major bank was when our senior management team wasn't all focused on the same goal.

Usually, this was not a problem at that bank because each year's goals were clearly articulated to us all and the expectations were clearly set. This was reiterated weekly and reviewed monthly and if you were not progressing properly, you were probably getting "help" to rethink whatever it was you were doing.

But there were times when people had personal issues, or there were some real obstacles to our functioning as a team. Differences in beliefs about whether we could actually achieve the goals, differences in how we should get there, differences in how we could or should work together and who should take specific roles or responsibilities and always, opinions about whether they were getting enough support from marketing.
Sound familiar?
When the team's alignment is not there, it feels different. You can feel disoriented, you start looking at what your personal goals are versus the bank's goals. You lose focus. You start blaming others for shortcomings. You start down that slippery slope of negativity that kills a team.

If you are a leader of a team or bank or any other group that is trying to achieve something big, something more than you are, don't let this happen!
The cure is available through a great process that I have seen work in other's peoples lives and in some of the world's biggest organizations, and has certainly worked in mine. It is a process called your "Best Year Yet".

The magic happens when alignment is in place; whether for yourself personally, in a marriage, or in a team trying to reach the top of Mount Everest. Find out more at www.bestyearyet.com.

Have a wonderful, aligned, and enlightened weekend!
Sharon

Updated Versions of the Keyword and Placement Tools - Now in Beta

Feeding off the momentum of improvements we've made over the past year in AdWords, we recently released beta versions of the updated Keyword and Placement Tools.

We've maintained the core functionality of these tools, but have added some new features that we hope will make them more useful for you. If you use English as your AdWords interface language you may have noticed that you already have access to these tools, and availability to all English advertisers as well as other languages will be rolling out over the next few weeks.

The updated Keyword Tool (beta)
This new version of the Keyword Tool combines the functionality of the Keyword Tool and the Search-based Keyword Tool. This means you'll get keyword ideas based on keywords you enter, your website content, and user searches - all in one place. Also new is the ability to search by any combination of a keyword, website/URL, or category - instead of having to perform each of these searches separately. Additionally, you'll be able to see all match types for a keyword at the same time to help you compare statistics for each match type. When you've got your final keyword list together, you can download a selected keyword, all keyword results in the table, or all keywords (for certain queries).

The updated Placement Tool (beta)
As with the updated Keyword Tool, you can now search for placements by any combination of keyword, website/URL, or category. For example, you can search for placements that are only on youtube.com that are also video placements and that are also in the automotive category. Under Advanced Options, you can also further filter placements by Country or Language, Impressions Per Day, Included Ad Sizes (those sizes offered by the content publisher for their offered placements), and demographic options.

The updated Keyword Tool is available via a link in the current Keyword Tool and the updated Placement Tool is available via a link on the Tools page.

If you see these links in your account, we encourage you to test out the new versions of these tools.

Thursday, September 24, 2009

Fall In Love With Motion Charts


Have you used Motion Charts yet? If not, it's a little like playing an instrument. It takes a little practice, but once you get the hang of it, it's the best thing you ever did - fun and informative and you'll want to do it daily. Create them and watch them reveal patterns you weren't aware of in your keyword activity or some other area that is important to your site.

We've written a few posts on Motion Charts and made a video, and now we wanted to refer you to a great article called How To Use Google Analytics Motion Charts To Maximize Results, on Searchengineland.com, written by one of our Authorized Consultants, Daniel Waisberg from easynet search marketing in Israel.

Daniel discusses both how to use Motion Charts and also what metrics to designate as which elements of the chart to best use the feature for optimizing your online marketing. In his example, Daniel chooses to have conversion values as the size and color of the bubbles so you can easily spot them for optimization opportunities. For instance, for an e-commerce site and a motion chart showing keywords with the y-axis as visits and the x-axis as bounce rate, Daniel says:
Ecommerce conversion rate (color of bubble) shows the conversion rate for a keyword. This is important since you might have high converting keywords that are not receiving enough traffic. Look for red-small bubbles located close to the x-axis—these keywords should get priority optimization treatment. Tip: focus on these and related keywords on your PPC campaigns.

Revenue (size of bubble) shows the amount of money this keyword is driving to your website. Look for big-blue bubbles—this is a signal that a keyword brings lots of money but could bring even more if it converted better. Tip: optimize the pages related to these keywords to improve conversion.
Daniel also goes into detail about how to share motion charts with others. If you're ready to try Motion Charts today, his article is your next step. Then, for more inspiration, here are a few more examples of using them.

Don’t Plan to Fail in 2010

Avoid the Top 3 Strategic Planning Pitfalls

Not all strategic planning is created equally. The majority of companies find a mere 63 percent of the goals outlined in their strategic plan are achieved each year. Why leave all of that opportunity on the table?

How can you pull the extra level of growth out of your strategic plan? Make strategic planning an ongoing process rather than an annual event combined with a golf outing or Board retreat.

Most companies see goals fail because their strategic planning process lacks three basic components necessary for success.

• A chain of leadership involvement that extends beyond Executive leadership to include those business leaders actually responsible for producing results.

• A defined accountability program to achieve the goal and detailed process for ongoing progress reviews.

• A platform that includes ongoing monitoring and review to take strategic planning from a onetime annual event to an evolving growth process.

Incorporate these three elements into your planning and you’ll achieve more next year. Or, consider successful planning programs like Best Year Yet®, a strategic planning process that achieves significant, measurable and relevant results by generating alignment to move everyone in the same direction. Best Year Yet is a program that changes behavior, culture and performance to deliver success year after year.

Want to find out more about Best Year Yet – email Sharon Lovejoy at slovejoy@marketmatch.com and plan for success in 2010.

Deanna

Wednesday, September 23, 2009

New Video: Steps to Using the Analytics API


Last week, in our Google Analytics API video series, Jacob Matthews discussed What is the Google Analytics API? In this new video, Jacobs goes deeper and describes the three steps developers need to take to retrieve data from Google Analytics: Authentication, Account Query, and Profile/Report Query.

Feeling inspired? Play with our interactive javascript examples to see the API in action.

Top 4 Things You'll Need to Consider Before Starting 2010 Planning


It’s that time of year again. As you sharpen your pencil to start 2010 planning and budgeting, consider the following:

4. Local Economy: By making a few simple clicks or calls to your city or county, you can quickly assess the local economic environment. Also try calling a local college economics department for local data. Consider:

  • Are jobs growing or shrinking today in each of your markets? What will they be doing in the next 6-9 months? What businesses are doing what? Use this information to target your business development strategies.
  • What are the overall local economic trends? Look at real estate, household income, employment, retail sales, etc.
  • How does all of the above information drive Product Need? Are there specific products that you can focus on in 2010? Do you need to create new products or services?

3. Existing Customers: It costs far less to increase penetration with your existing customers than to acquire new ones:

  • How are your current customers using your products and services? Look at services per household, checking penetration, loan penetration, available lines of credit, debit card usage, online banking usage, etc.
  • Identify your most profitable customers and target those who look just like them.
2. Competition: You can hire an outside shopper or simply take a day or two and shop the competition yourself. It’s important to understand:

  • What new competition has entered the area? Who’s left?
  • Review your key competition’s Product Mix.
  • How are they Packaging their products? Do they have Relationship Pricing? Are they bundling products?
  • Make a list of all of your competition’s Advantages and Disadvantages.
  • Use this to Differentiate yourself!

1. ROI: By truly understanding and reporting your marketing ROI, you can brand yourself and your department as the greatest profit center in the bank or credit union.

  • Set measureable ROI goals for each promotion as well as overall annual goals. Track regularly - not just at the end - this will help you know if you need to deviate from the plan.
  • Look at everything: fee income, product profitability, brand equity, etc.
  • Become your greatest spokesperson! Report everything … even the tactics that didn’t meet expectations and share what was learned.
  • If your institution has one dollar to spend, show then that the highest return on investment is through marketing.
Take care,
Eric

Monday, September 21, 2009

Stay Connected with your Google Industry Team on Twitter

Did you know that searches for "coupons" are up by as much as 95% year-over-year? Or that Google.com is highlighting TV and movie previews with our Video Plus Box product in the search results? Or even that "things to do" searches hit an all time high this summer?

The Google Auto, Media and Entertainment, Financial Services, Retail, Tech, and Travel teams are excited to announce the launch of our Twitter profiles.

Through the profiles, our teams will share:
  • The latest industry trends and information
  • Google insights and news
  • Relevant product information and updates
To follow us, please click your industry: Auto, Media and Entertainment, Financial Services, Retail, Tech, and Travel

Back To Basics: Save Clicks, Save Time

Did you know that you can save clicks and jump directly to a deep-level report from your dashboard? Let's say that you want to see which cities in California you get traffic from. Ordinarily, you'd need to click Visitors, then Map Overlay in the report navigation. Then, you'd need to click United States, then California. But, you can save 3 of these 4 clicks by simply adding this report to your dashboard.

Try it now. Go to one of your favorite reports that requires several clicks to access. Once you've arrived at the report you want --and at the level you want it -- click Add to Dashboard. (The Add to Dashboard button is at the top of your report on the left, next to the Export and Email buttons.)


You'll now see the report on your dashboard. The next time you log in to your Analytics account, you'll be able to see the top cities from California on your dashboard and jump right to the report with a single click.


Sunday, September 20, 2009

Finding a Way...

As you may know, I am a HUGE Ohio State Buckeye fan and also a Bengals fan.  To many, the success of the Buckeyes is great...and the pain of the Bengals is tough to take.  Both, however, have had equal shares of triumph and heartbreak...but recently they have also Found A Way!

My message is about finding a way...finding a way to victory even when the times are tough, the competition seemingly insurmountable and the odds stacked against you.

The Buckeyes and the Bengals both came back from heartbreaking last second defeats from a week ago...both have been pinpointed by many awaiting an even bigger failure. However, they both circled the wagons, talked about the team spirit and rode the wave to victory...DESPITE the odds, the competition and the neysayers...they found a way!

The economy is tough for bankers right now...the budgets are slim for marketers and the demands of customers never bigger...but YOU CAN FIND A WAY to victory.  It just takes three words to be repeated as often as necessary.  This will sound VERY trite, but it is true and it works...ready?

The three words are...

YES I CAN!

Yes you can....
  • Make an impact with the budget you have
  • Overcome the competition
  • Make it through the fall planning sessions
  • Grow you loan base
  • Positively impact your attrition rates...
  • and MORE!
You can do it!!  We have faith in you....but you need to take the 1st step....Repeat after me...

YES I CAN...

If you need a daily re-affirmation...call me...I would be glad to help!  After all, a Bengal's fan is used to saying "tomorrow will be better!!"

Cheers!

Bruce

Friday, September 18, 2009

New Analytics API Features including Event Tracking!

We are excited to be releasing new features -- features that have been prioritized based on feedback from you.

Event Tracking

Get Excited! Event Tracking, our number-one feature request, is available through the API. You can use event tracking to measure the number of user interactions with a website. For example, you can track:
  • the total number of times a white paper is downloaded
  • the length of time it takes to load a video
  • the number of validation errors users get when filling out a form
If you already have an integration with Google Analytics, Event Tracking is even more exciting. To illustrate, let's look at Sprout. Sprout's integration with Google Analytics helps customers track user interaction within their Sprout content. However, users currently must log into the Sprout interface to see billing and account management data, and then also log into Google Analytics to see how their own sprouts are performing. Now that event tracking is available through the API, companies like Sprout can pull the interaction metrics tracked by Google Analytics events and present them directly in clients' performance dashboards--effectively leveraging Google Analytics as a platform to power their analysis reports.

Ready to try out Event Tracking yourself? Check out the event tracking API docs, or fire up the Query Explorer tool.

Navigational data


The Google Analytics web interface provides a navigation report. Analysts use it to infer which links visitors click on, from one particular page to the next. Now that this data is available through the API, you can create new visualizations, such as custom site overlays, to see which links get the most clicks.

Increased filter length

The length of filter expressions has been increased to 128 characters. This enables developers to perform more complex queries with fewer requests to the API, saving bandwidth and quota.

There is a detailed list of all these changes in our public change log. We hope you find these features useful to your development and look forward to your comments and continued feedback. If you haven't done so already, please join our public Google group and let us know how you've been using the API.


Nick Mihailovski

Thursday, September 17, 2009

Announcing the new DoubleClick Ad Exchange

You may have seen our post on the Official Google Blog, announcing the new DoubleClick Ad Exchange. The Ad Exchange is a real-time marketplace to buy and sell display advertising space.

The "buyers" in the Ad Exchange are typically ad networks and agency-run networks with their own ad serving and optimization technologies, while the "sellers" are large publishers.

We're excited about what the launch of the Ad Exchange means for you, our advertisers. Ad Exchange sites will now be available for you to advertise on, as part of the Google Content Network, through your AdWords account. These sites are made available to you when Ad Exchange publishers choose to allow AdWords advertisers to compete for their inventory, and as long as that inventory meets all AdSense policy requirements.

So when you advertise on the Google Content Network, your ads will now be eligible to run across additional high-quality placements on those Ad Exchange sites, in addition to the hundreds and thousands of placements your ads can run on in the Google Content Network.

These placements will appear like any other Content Network placement in your AdWords reports. Like all Content Network placements, you can use the Placement Performance Report to see where your ads ran, which placements performed best, and act on that information by increasing or decreasing bids based on each placement's performance. On occasion, an Ad Exchange site may choose to remain anonymous, in which case, the site will appear in your reports with an anonymized label like "123456.anonymous.google." You can choose to exclude this placement, just like you can exclude any placement in the Content Network, if you see it's not meeting your performance goals.

You can still use all the AdWords targeting, bidding, formats, reporting, and controls for the Content Network that you're already familiar with. This just means that there will be more high-quality sites that you can access. As always, sites must meet the same quality requirements that we apply to all sites in the Google Content Network. Also, this change does not affect your search campaigns.

You can learn more about how the DoubleClick Ad Exchange can benefit you in the AdWords Help Center.

If you're not currently using the Google Content Network, you can learn more about how to get started here. If you're using the Content Network but have never tried running display ad formats, you might check out our Display Ad Builder tool, which can help you create new display ads in minutes.

New Video: What is the Analytics API?


I spent a day in Irvine, California interviewing some of the software engineers who built the Google Analytics API, starting with Jacob Matthews, the tech lead behind the API. If you haven't read any of our API documentation yet but you have been wondering what the Google Analytics API is all about, we put together a couple of videos where we hear about the API from the people who built it. Here is the first one where we keep it high level and ask Jacob, "What is the Google Analytics API?"

Enjoy!

Wednesday, September 16, 2009

New AdWords Bidding Tutorial

For today's Inside AdWords post we have a note from our Chief Economist at Google, Hal Varian. Hal and his team spend most of their time studying the AdWords auction and finding ways to make it more efficient. Today he'd like to share a new tutorial he and his team have put together on how to bid for maximum profitability on AdWords:

Last month we launched a new feature of AdWords called Bid Simulator. Bid Simulator takes some of the guess work out of cost per click (CPC) bidding by estimating the number of clicks or impressions you could have received if you had used a different maximum CPC bid. Today, I thought I would take the opportunity to help you make the most of this new feature by explaining how to use the data from Bid Simulator to maximize the profit from your marketing investment.

In general, when you increase your maximum CPC bid for keywords on search you are able to generate more clicks to your site. This may be because your new bid qualifies you to appear higher up in the Sponsored Links on the search results page, or because your higher bid qualifies your ad to appear in new, more expensive, auctions. The goal for you as an advertiser is to decide whether or not these additional clicks come at a cost that is still profitable for you.

To make this decision, you need to compare your expected value per click to your incremental cost per click. Your value per click is how much a click for a particular keyword is worth to you, on average. Your incremental cost per click is how much extra you are paying, on average, for the extra clicks you are getting from your higher bid. When your value per click is higher than your incremental cost per click it makes sense to increase your bid. On the other hand, if your value per click is lower than your incremental cost per click, you probably want to decrease your bid.

In the following video, I'll show you how to calculate these values, how to interpret them, and how to use the data to maximize the profit from your marketing investment. My team and I are always looking for ways to help make the AdWords auction easier to understand so if you have other topics that you'd like us to address, please leave a comment on the video and we may be able to make it a topic for a future video.


You can also watch the video or read the transcript in our help center:
http://adwords.google.com/support/aw/bin/answer.py?hl=en&answer=163828

Tuesday, September 15, 2009

Upcoming Google Website Optimizer webinar

We've posted before about how testing your website landing page can increase your conversions from AdWords. Back in July we held a webinar on the "7 deadly sins of landing page design" and next week we'll hold the second webinar in that series: "Planning and running your first experiment in Google Website Optimizer."

The webinar will cover how to plan and set up your first experiment for testing your website landing page, while also providing tips and best practices that will benefit even those of you who are already pros at testing and optimizing your landing pages.

The webinar will be on Thursday, September 24th at 10AM PDT. You must register for the event to attend. We hope to see you there!

Sunday, September 13, 2009

Sun in San Antonio...

Arrived in San Antonio for the ABA Marketing conference on Friday...had a couple of meetings on Friday that went really well!

When I landed, it was rainy and gray... I thought I was back in Ohio!  However, everyone was ecstatic that it was raining.  See, in San Antonio, they have been in a pretty serious drought and have very stringent water restrictions.  In Ohio, we have had plenty of rain and a pretty temperate summer....very few days in the 90s. 

My point is that the perspective is 180 degrees opposite even around the same issue....rain.  I was disappointed in the rain, and San Antonians were excited!

Keep this in mind when you talk with your customers.  Come from THEIR perspective in your communications, know THEIR thoughts and feelings, and ensure that you are communicating in the manner that will be best be heard by your audience!

PS...the good news is that San Antonio got their rain, and today is a sunny day for me!

Cheers!

Bruce

Friday, September 11, 2009

Using Google Analytics To Identify High-Performing Keywords

The topic of using Google Analytics to optimize your PPC keyword buys never gets old. We have posted about it here a bunch. It's putting your PPC money where your analytics mouth is, uh, for lack of a better metaphor and is one of the core reasons to use web analytics. Recently, a Google blog called Solutions for Southeast Asia wrote a post about this topic, covering the techniques to use Google Analytics and AdWords to find and add the most effective unused keywords. It's a great post - definitive and very thorough, going from soup to nuts, expanding on these steps:

Step 1: Ensure Goals and E-commerce Tracking are set up
Step 2: Access the Keywords Report
Step 3: Export non-paid keywords to a spreadsheet
Step 4: Expand the list of keywords using other Google products
Step 5: Download a list of keywords that you are already advertising on
Step 6: Identify keywords you are not advertising on
Step 7: Expand on these keywords and start advertising


For explicit directions on each of these steps, take a read of the article. You and your website will benefit. Of special note - step 4, which we've pasted in below. As you can see, Vinoaj, the author, gives you an extensive list of Google products that can help you refine or expand your keyword list. Some of them you've probably never even heard about, but will simply take your targeting to the new levels, especially when budgets are tight but you want to grow your business as Q4 approaches.

To consider more keyword options, consider using some of Google's other free products to discover more opportunities: Google Insights for Search, Google Trends, Site Search reportsin Google Analytics, Webmaster Tools, and even the new Wonder Wheel. If you are an AdWords user take a look at the Keyword Tool, Search-based Keyword Tool, Search Query Performance reports, and more. Once you have identified additional keywords you would like to advertise on, add it to your list of keywords from Step 3.

Happy analyzing!

Wednesday, September 9, 2009

AdWords system maintenance on September 12th

On Saturday, September 12th, 2009 the AdWords system will be unavailable from approximately 10AM to 2PM PDT, for maintenance. While you won't be able to sign in to your accounts during this time, your campaigns will continue to run as usual.

AdWords system maintenance typically occurs on the second Saturday of each month from 10AM to 2PM.

We'll continue to update you via the blog as we always have, but please make note of the September 12th date and of our scheduled maintenance further down the road.

It's all in 24 hours...how will you fill your card?

Greetings...

Happy Wednesday, the middle of the week.

Today, I will share about 24-hours... recently their value has increased tremendously to me!  24 hours...seems like a lot, or very little, depending on your outlook.

The key is "how" you look at them...and "how" you use them!  I am definitely a Glass-Half-Full person.  Perhaps you are a Glass-Half-Empty person, or a close friend of mine that is a "what friggin glass!"

Any way you are, its important to fill your 24-hour time card the best way possible.  For a typical person:
  • we work for 8-10 hours
  • sleep for 6-8, 
  • and have 6-8 hours of family or personal time.
For me...I minimize sleep, rearrange my work hours and recently have tried to max my family time.

At work, I maximize my efficiency and find that late at night or early morning are "knock it out" times for me when I can focus and have minimal distractions.  To me, sleep is overrated...but important to catch up when we can.

We all have 24 hours and HOW we fill them is critical to our health, wealth, and well-being.

Find your balance and fill your card out...and remember, the 24 hours are either VERY quick or VERY slow....pending your outlook!

Cheers!

Bruce

Tuesday, September 8, 2009

Opportunities Tab Beta: Now available to more advertisers

In July we announced US beta testing of the Opportunities tab, a new section in your AdWords account designed to help you find additional cost-effective traffic for your search campaigns.

Today we've begun expanding the beta to additional US advertisers, and we've also started including UK and Australian advertisers in the test. We'll make the Opportunities tab beta fully available to all English-language accounts over the next few business days.

Now that we're expanding the beta, we'd like to answer a few questions we heard during the initial test:

When should I use the Opportunities tab?
You can think of the Opportunities tab as your homepage for account optimization. You can use the tab to get a quick overview of Google's customized keyword and budget ideas for your campaigns and ad groups. You can also compare the impact of different ideas before making changes. So, if you're looking to increase your keyword coverage for a specific product, or have your ads appear more often for your existing keywords, the Opportunities tab is a great place to start.

We regularly update our list of ideas, so even if you've visited the Opportunities tab in the past, you may want to check back every few weeks to see if your keyword or budget ideas have changed.

Where did my AdWords Tools go?
We're not retiring any of the existing AdWords tools with the Opportunities tab beta test, but we've changed where they're found. If you're included in the Opportunities tab beta, you'll no longer see a Tools tab. Instead, you can access AdWords tools by clicking on the Opportunities tab and scrolling down the menu on the side of the page. You can also see lists of ideas by campaign by clicking on any of your campaigns listed in the menu on the left side.


To see a full list of available tools, simply click the "More tools..." link at the bottom of the list.

What optimization tools will I see in the future?
This beta test of the Opportunities tab is just a starting point for a broader set of optimization tools we hope to provide in the future. Over the coming months you can expect to see additional changes to the tab focused on giving you more insight into the broader search marketing landscape and more data to help you better estimate the effectiveness of new ideas.

Ultimately we want the Opportunities section of your account to evolve into a single destination you can visit whenever you want to get new ideas for increasing your ad coverage on relevant search terms, capturing additional clicks in your most profitable campaigns, or simply improving your overall ROI.

We plan to expand the Opportunities tab beta to all global advertisers over the coming weeks, and we'll continue working on improvements to the tab on an ongoing basis. In the meantime, if you have any suggestions for improving account optimization, please let us know by submitting feedback in your account.

Friday, September 4, 2009

Episode 3 Of Bottlenecks To Implementation: Should You Use An Agency?


Here is the final episode of our three part series on bottlenecks that companies face implementing web analytics. In this episode, we ask the question, "Should you use an agency, or can you do everything (implementation and analysis) in house?"

Bottom line: you need big brains.

And if you decide to go with one of our authorized consultants, you can find one near you. They are analytics do-everything agencies which often double as SEMs, SEOs, and Website Optimizers so you get the full circle of support for almost everything you do online - including strategic recommendations on improving your web presence and marketing.

Thursday, September 3, 2009

New Interface Thursdays: A look back and a farewell

For nearly five months we've been running New Interface Thursdays here on the Inside AdWords blog. As the new AdWords interface moves to simply being AdWords, we're bringing this series to a close.

You can find all of the posts in the series under the New Interface label, but here are some of our favorites:
We look forward to writing more about AdWords every day of the week. Thanks for a great series.

Wednesday, September 2, 2009

Get on the (Google) Map!

As an AdWords advertiser, you're likely focused on making sure your paid advertising campaigns are performing well and delivering positive results - but have you also thought about taking advantage of the free ways you can promote your physical business location on Google and Google Maps as well? In this post, we'll show you how to ensure your business locations can be found on Google, and then we'll show you how to go a step further by promoting your locations with AdWords location extensions.

Free promotion
If your business already appears as a search result on Google.com and Google Maps, you can use Local Business Center to claim your listing and add additional information, such as photos, videos, business hours and more. It's completely free. If your business doesn't currently show at all, you can create a new listing, which is also free. Local Business Center recently launched a dashboard that lets you see how many users saw your listing, how many clicked on various links in your listing, and which search queries caused your listing to appear. To get you started with Local Business Center, we've put together some helpful tips on the kind of information you can and should include in your listing.

Drive even more sales with paid promotion
In addition to ensuring your organic listings are up-to-date, you can use AdWords ads for additional promotion. Both location-targeted text ads and location extensions can appear on Google Search and Google Maps result pages. When you create location extensions, you'll be able to show your business addresses within your text ads. If you're a primary business owner, you can link your Local Business Center account with AdWords to ensure the most up-to-date information about your business is appearing within your ad. When you use extensions, you'll also be able to upload a custom icon that will appear when your ads show on Google Maps. This allows you to take a more active role in ensuring your business locations stand out when users look for businesses like yours in your area.

So what are you waiting for? Take the first step and get yourself on the (Google) map by claiming or listing your business in Local Business Center.