How do you track online lift from an offline campaign, such as a promotional event, coupon campaign, or TV spot? Check out this article by Melissa Campanelli for DMNews : "Careerbuilder.com Uses Web Analytics to Track Online Lift."
To sum it up, online recruitment and career site Careerbuilder.com used Google Analytics to measure the increase in traffic that resulted from offline promotions. They launched a college campus educational campaign where they "sponsored career fairs, athletic and social events and also organized guest speaker events to give students a chance to learn about career opportunities." Over a few months, Careerbuilder.com threw eight different activities at 50 campuses and then systematically studied incoming traffic. One event, according to Nathan Lippe, collegiate marketing manager at CareerBuilder.com, generated "off the charts" traffic to the site. What happened? Mr. Lippe was able to determine the cause of the traffic spike, refine the campaign strategy, and repeat the instance of unexpectedly impressive success. Take a look at the article for all the details on how he did it.
Friday, September 29, 2006
Thursday, September 21, 2006
Raising your profile
Another (barely detectable) profile pun in a post title? That must mean we've increased the default number of profiles in your account again. We recently announced that we increased it from 5 to 10. Today, we're announcing that the default number of profiles in all accounts has increased from 10 to 50.
We'll continue to add benefits like this for existing users - and there are more and more of you every day.
Here is a help center article that explains what profiles are and offers ideas on what to do with these additional profiles, such as track more of your sites or use filters on a duplicate profile to customize the report data that you see. Also, the Managing Profiles section of the Google Analytics Help Center contains more information about creating and using your profiles.
Wednesday, September 13, 2006
Spotlight on: How to read the ROI column
One of the nice things about Google Analytics is how easy it is to see ROI for each of the keywords you buy on AdWords. But what do those ROI numbers in your reports really mean?
ROI is (Revenue - Cost)/Cost, expressed as a percentage.
-Revenue is taken from either the value you set as your goal value(s), or from e-commerce revenue values if you have set up e-commerce tracking.
-Cost is currently only derived from your AdWords CPC (cost-per-click) values imported from your AdWords account when you link your Analytics and AdWords accounts with auto-tagging turned on.
An ROI of 0% means that you earned in revenue the same amount of money you spent. An ROI of 100% means that you spent, say, $5, and made $10. In other words, you spent X and received 2X in revenue. A minus sign (-100%) indicates that you lost all of the money you spent. (If your numbers are all -100%, it's probably because you haven't configured e-commerce or defined values for your goals and therefore Google Analytics isn't registering any revenue.)
It's not uncommon to get an ROI percentage of several hundred or even several thousand. These kinds of ROIs simply indicate that your Revenue is many times greater than your Cost. Depending upon your business, you might need an ROI of 1000% just to break even. Let's say that you sell golf clubs online for $500 per set. You spend $100 on the keyword [beginner golf clubs], which results in 5 sales for a total of $2,500.
In this case, the AdWords Analysis Report will show that you've made a 2,400% ROI. But you need to factor in your operating expenses and your production costs to understand how much money you've actually made. For example, if your cost of purchasing or manufacturing the clubs is $350, you've really only made $150 per set x 5 = $750. That gives you an ROI of ($750 - $100)/$100 = 650%.
It's best to use ROI as a guide to your keyword spending instead of as the final answer on how much you've made. Those of you who want to learn more about keyword buying metrics might be interested in this post: what's a visit worth?.
Thursday, September 7, 2006
Tip: Tracking 404 Pages
Besides telling you from which sources your site traffic originates, Google Analytics also tracks just about any activity that occurs on your site, including popular navigation paths, plus track downloads, outbound links, and activities on cross-domain properties. But one shortcoming is the lack of reporting on 404 pages, which appear when there's no file or page that corresponds to the visitor's request. For example, sometimes visitors will type in a filename that they think is available on your site, or sometimes your site might have a obsolete link which routes to a deleted or non-existent file or directory. In both cases, a 404 or "Not Found" error page will appear on the browser.
It's valuable to see these requests so you can learn what visitors are looking for, and consider adding new content or fixing the broken link.
Reporting on missing or error pages requires a few steps:
1. Add the Google Analytics tracking code to a custom 404 error page
2. Modify the tracking code on the 404 page as follows (see the urchinTracker modification in red below):
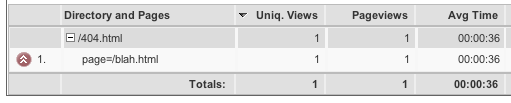
3. Look for /404.html in your Top Content report. Or to make it easier open the Dynamic Content report and expand the list for "/404.html."
It's valuable to see these requests so you can learn what visitors are looking for, and consider adding new content or fixing the broken link.
Reporting on missing or error pages requires a few steps:
1. Add the Google Analytics tracking code to a custom 404 error page
2. Modify the tracking code on the 404 page as follows (see the urchinTracker modification in red below):
<script type="text/javascript"This code sends a virtual pageview of "/404.html?page=[pagename.html?queryparameter]" to your account, where [pagename.html?queryparameters] is the missing page name.
src="http://www.google-analytics.com/urchin.js">
</script>
<script type="text/javascript">
_uacct = "xxxxx-x";
urchinTracker("/404.html?page=" + _udl.pathname + _udl.search);
</script>
3. Look for /404.html in your Top Content report. Or to make it easier open the Dynamic Content report and expand the list for "/404.html."
Subscribe to:
Comments (Atom)