Wednesday, September 2, 2009

Checking the Pulse of Ads and Brands

As an advertiser, you've probably wondered from time to time what people thought about your marketing efforts. How are they responding to your ads? Do they like them? What do they think about your brand? With many advertisers running display campaigns across the Google Content Network, we’re starting to test some interactive ways for brand advertisers to get feedback on their marketing efforts. In the coming months, we’ll be experimenting with some new approaches that help measure the impact of AdWords campaigns beyond traditional click-through and conversion metrics.

The first is a way to gather feedback on display ads. We start by taking a display ad and removing all traces of the advertiser's brand. We then show this de-branded ad on the Content Network, and present a few basic questions: 1) Have you seen this ad?, 2) Did you like it?, and 3) What was the product or brand being advertised? This simple and approachable ad encourages users to provide feedback, and it also gives advertisers more information on whether people liked the ad and whether they remember the ad and were able to link it to the brand.

This is what users see:


We're also testing a second approach to brand monitoring using gadget ads served on the Content Network, where we give users the chance to share their thoughts about a set of brand or product names. Over time, advertisers will be able to understand how their brand perceptions and associations are shifting, and they can tailor their marketing messages accordingly.

Here's an example:


In the coming months, we'll be testing these ideas with a limited set of advertisers in the U.S. and the U.K. with the goal of making it available to more advertisers. With these experiments, we hope to provide you with more actionable insight on how users respond to your ads and brands.

Tuesday, September 1, 2009

Episode 2: Bottlenecks To Implementation For SMBs


The first episode in the three part "Data Driven Discussion" series about bottlenecks to implementation focused on large, enterprise-class companies. In this episode, we ask our experts Nick and Avinash the question, "What obstacles does a small-to-medium sized business face in implementing analytics?"

SMBs are often more nimble than large businesses but resource-constrained with everyone working overtime. A lot is at stake. In this environment, analytics can have a huge impact, answering questions and giving guidance through data to back up major decisions.

Google TV Ads announces the TV for All contest

Small businesses often think that television advertising is too costly and cumbersome for them to use. They assume they need a fancy, expensive commercial to use in their TV campaign. But Google TV Ads changes all of that -- we make it easy and affordable for you to make a TV ad, plan a campaign, and reach your customers through the power of television.

We're excited to announce the Google TV Ads' TV for All contest www.youtube.com/tvforallcontest, everyone's chance to advertise on television. Enter your small business' commercial in the contest for the opportunity to win $25,000 worth of free national advertising on cable channels such as CNBC, Hallmark, and Bravo using Google TV Ads!

We're launching the contest today in collaboration with our partner SpotMixer, a self-service video creation service which allows consumers to easily produce professional-quality videos. All you need to do is this:
  1. Create a thirty or sixty second commercial for your small business -- you can make an ad on your own or use the free Spotmixer tool (it's easy!).
  2. Upload your ad to the TV for All YouTube contest brand channel.
  3. Vote! Once your submission is up on www.youtube.com/tvforallcontest, our panel of celebrity judges will select the 10 finalists and the YouTube community will choose three winners, each of whom will receive $25,000 in free national TV advertising through Google TV Ads.
The contest submission deadline is October 5, and winners will be announced on October 30.

Full guidelines, contest rules and tips and tricks are available on the TV for All YouTube contest brand channel at www.youtube.com/tvforallcontest. Enter today!

Monday, August 31, 2009

The Value Of Landing Pages

Imagine that we're launching a brand new advertising campaign for our new e-commerce website that sells Empanadas, my favorite food. The structure of the website is simple. We have a homepage, a few category pages that lists empanadas by type (baked, fried, etc), and hundreds of individual pages for each type of empanada (ham and cheese, steak, chicken, veggie, etc.).

Website structure

(click to enlarge)

Given this site design and our goal to sell as many empanadas as possible, let's look at this question:

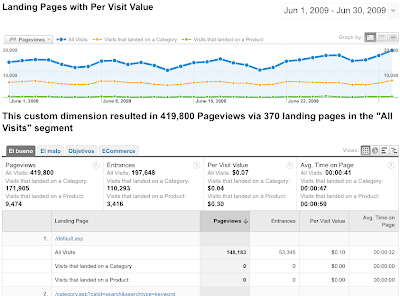
Which type of landing page (home, category, or product) leads people to purchase more empanadas?

To answer it, we'll use two Google Analytics features, Custom Reports and Advanced Segments, to find out exactly, in dollars, which is the best type of page. And to perform this analysis we need one of two things: 1. e-commerce or 2. goals with a goal value.

Searching for the answer in Landing Pages
First go to the Content > Landing Pages.

(click to enlarge)

This report is naturally a good place to start but it only gives us three metrics: Entrances, Bounces and Bounce Rate. I want to know dollar amount, not bounce rate. To get the value of each landing page we have to create a custom report.

Step 1) Create the Custom Report
Go to Custom Reporting and create the following report:

Dimension: Landing Page
Metrics: Entrances, Abandonment Rate, Goal Completed and Value per visitor

(click to enlarge)

Great. Now I know the average value for any visitor that starts on these pages. On average the value per landing pages is $0.07. This means for all people who arrive at my webpage, on average each person will buy $0.07 worth of empanadas. Not much huh? However, as you can see some pages have a consistently much better conversion rate than others. For example, my home page -- /home.html -- gives me a per visit value of $0.10. I'd like to compare that with my other two page types: product and categories. We could go through this list and pick out one by one which is better, or write a regular expression in the search filter box, but an easier and more flexible way to identify these page is via Advanced Segments.

Step 2) Create the Advanced Segment
Take a minute to think about the layout of your website. Is there a unique identifier that let's you segment your landing page types? If there isn't then ask your Webmaster what you can do to get around this problem. In our example, remember that our website is very simple. Every empanada page contains the word empanada.html, every category page contains category.html, and the home page is home.html. To begin with, let's create a category segment.

Create the "Category" Advanced Segment
1. Go to Advanced Segments>Create New.
2. Dimension: Landing Page
3. Contains "category.html"
4. Name it "Visits that land on Category."
5. Save and Apply to report

Ouch! Visitors that land on my category pages spend an average of $0.04. Much worse than the average of $0.07. Now let's compare with what happens when a user lands on a page of an individual empanada product page. It's the same process as above except we use Landing Page Contains "empanada.html."

Create the "Empanada" Advanced Segment
1. Go to Advanced Segments>Create New.
2. Dimension: Landing Page
3. Contains "empanada.html"
4. Name it "Visits that land on empanada."
5. Save and Apply to report

Here is what we get:

(click to enlarge)

Wow! Visits that see a product page before anything else spend $0.30 on average. That's over 7 times more than the value of the category landing pages. Which pages should we use? Our empanada pages of course! We no longer have to guess which page is best. Even if we have hundreds of different types of empanadas we can calculate to the penny the potential value of focusing our advertisements on products.

Yeah, that's nice but how do I do the same for my website?

The above is a great example of full circle analytics. Set up goals, then create the reports and segments you best need to analyze the success of the goals. We chose to look at Landing Pages, but after you have goals, reports and segments in place, you can do most analyses.

Here are the key takeaways:

1. Most importantly your URLs must have a unique identifier (like our ?type=empanadas) so you can segment by page type AND either e-commerce implementation or a goal value.

2. Instead of thinking home, category, and product think home, broad, or specific. Usually, the more specific and focused the landing pages the better.

3. If you don't use an e-commerce website don't worry, you can do the same analysis. For e-commerce websites its much easier for us to calculate exact dollar return -- but! we can also use goal value to calculate user value. So, if you don't sell a product, your goal might be to have the users fill out a contact form. If for every 100 users that fill the form you can gain 5 leads that over a month spend an average of $100 each then the value of your form is 5x$100=$500/100=$5 per form completed. This goal value can also be used to calculate landing page value.

Now that you know exactly how to use Google Analytics to identify the value of your landing pages it's time to apply the lessons to your website. How much money do your landing pages bring you?


Friday, August 28, 2009

An API Integration To Measure Significant Change

Sophisticated, useful and cool applications are being developed everyday through the open Google Analytics API. We're loving what we're seeing. Basically, developers are grabbing their data from Google Analytics and slicing and dicing it, mixing it and mashing it with other data and applications, creating dashboards and widgets, and innovating some of the coolest stuff a data driven person could hope for. For example, we're really impressed with an app called Trendly which makes it easier to find important movers and shakers among your data via an innovative new interface, cutting down on the time you need to monitor your profiles. The team who built Trendly is using it as their one stop Google Analytics dashboard. We asked the team to share how this application came about, and here's what they wrote:
How many of you can afford to pay someone to monitor your analytics full time? We can't. We're a small startup, and we just don't have the resources to make that happen.

We use Google Analytics to track visits to our website, www.dabbledb.com. We'd love to have someone watching the hundreds of keywords, referrers, and campaigns that drive traffic to our site, someone who would send us a quick email whenever something really interesting happened: "Hey guys, thought you'd like to know that your average visitors from 'online database' doubled last week, and it's staying there - guess that SEO is working!"
So, using the Google Analytics API, we created Trendly, a monitoring and visualization tool which you can look at anytime and easily see what's changed. In short, Trendly uses mathematical models to take noisy data like this:

and figure out when significant changes have happened, marking it like this:

According to Trendly, our average daily visitors from the search words "online database" went up from 18 to 32 in mid-January, and then up again to 50 in early February. Also, Trendly sends us periodic emails to let us know about changes like these, saving us a lot of time. It also prepares a news feed with attractive charts that put the changes into perspective relative to everything else that's going on. Take a look at this - it calls out significant changes and makes them easy to notice with a timeline on the right.


When we first built Trendly for our internal use, we cobbled it together by screen-scraping and downloading exports from Google Analytics. But part of what made this tool exciting to us is that it solves a pretty universal problem. Trendly is your analyst until you can afford to hire a full time analyst. Heck, it probably keeps a clearer log of important changes than an analyst would! And with Trendly, you can delay this much longer since it cuts down your worflow by hours per week.

The new GA Data API allowed us to share it! With no signup and a couple of clicks, anyone can authenticate with Google and authorize us to grab their data and generate the reports. Suddenly our internal tool became a new product offering which can help any Google Analytics user. Give it a try and see for yourself.

What the guys at DabbleDB built is amazing.
If you have developed a useful new tool or integration on top of Google Analytics, drop us an email at analytics-api@google.com. If it's innovative and useful we'll highlight it to our readers on this blog.


More High Quality Templates and New Premium Fonts in Display Ad Builder

Last week we announced new high-end "Elegant" ad templates that can help you build great looking ads in minutes. Today we're releasing additional "Elegant" templates in the "General" category, as well as templates in a brand new "People" category. This new category enables advertisers to use templates that have professional images featuring people

In addition to these new templates, we also added 13 premium fonts that you can use to make ads with maximum visual appeal. They include: News Gothic, Gill Sans, Futura and Nimbus Sans. Here are some examples of the new ad templates and fonts:


With some of the new templates, you don't even need to upload any logos or images. With just a little bit of text you can create an appealing display ad in seconds.

To start creating your ads, visit the "Ads" tab in any campaign, click "New Ad," and select "Display Ad Builder' from the drop down." If you want to learn more about creating and running display ads, visit the Display Ads 101 tutorial.

Thursday, August 27, 2009

New Interface Thursdays: Tips for keyword management

Now that most advertisers are using the new interface exclusively, we want to share some efficiency tips to really unlock the potential of the new interface.

Focusing on what's important
In the Keywords tab you have several tools that help you focus on what matters to you.

First, you can customize columns to show only the metrics you care about and in the order you want. You can then use filters to focus on keywords that match a certain criteria. For example, you might only want to look at keywords that aren't converting well. Filters let you hone on what's important. You can find examples of good filters to try in this Help Center article.

And once you know what you're looking for, you can put AdWords on the look out. Using custom alerts you can tell AdWords what changes are important to you and be alerted when they happen both in your account and via email. For example, using filters you identify your best converting high volume keywords. You could create an alert to be notified if the conversion rate on those keywords drops compared to last week.

If you're working through a My Client Center account, note that you'll need to log in directly to an individual AdWords account to set custom alerts for now.

Changing many things at once
Once you've found what's important, the new interface makes it easier to make bulk changes to your keywords. First off you can select many keywords at once and click Edit to open up all fields for editing. To save time, you can do this all with your keyboard: select keywords with X, move up and down rows using J and K, and press E to get into edit mode. If you want to select a consecutive list of keywords, select the first keyword then hold the Shift key, and then click the last keyword you want selected.

While in edit mode, you can pause keywords, adjust your Max CPC, change the destination URL, and switch the match type. You can also copy bids and destination URLs to all rows. We've also recently added the ability to raise all applicable keyword bids to their first page CPC. From edit mode, just click Prefill all CPCs to first page bid.

You can also use spreadsheet editing to make bulk changes. Spreadsheet editing lets you work with your keywords as if you were using a spreadsheet. You can use formulas, copy and paste, and even find and replace. You'll find spreadsheet editing by clicking More actions then Spreadsheet edit. Remember that spreadsheet editing can only be done within an ad group.

Moving things around
Maintaining a good account structure is one of the keys to successful AdWords campaigns. So, from time to time, you may want to move things around a bit to create more refined, relevant sets of keywords and ads. This is where the copy feature comes in handy. Like spreadsheet editing, you'll also find copy under More actions.You can copy keywords to another ad group or campaign. When copying keywords, you have the option to also copy the bid and destination URL.

We hope these tips help you manage your keywords more effectively and improve your AdWords campaigns.