Wednesday, August 29, 2012

A Boy and His Dogs (5 Ways to Create Loyal Customers)


We started a fun new chapter of our lives last Friday when we got two new dogs.  Yes, TWO!!!!  What was I thinking?!?!

It got me to thinking … we’re starting new relationships from scratch.  Kind of like you do with customers every day.

So here are a few things that I’ve learned about loyalty from my dogs … and who knows loyalty better than a pooch?

Kindness
This one goes without saying – well, until now.  But, like pups, customers respond to a kind voice and gentle demeanor. 

Consistency
Dogs and customers both have a short memory.  They are most likely to remember their very first and very last encounter with your institution.  So you and your staff must be on stage and on-point with every single interaction.  You can “say” you have great service, but it’s the consistent application of great service changes behavior and breeds loyalty.

Immediate response
Things don’t always go as planned.  With our youngest puppy, I’m ready to hang a sign in the house that says, “XX Days Accident-Free.”  For the record, this morning the sign dropped back down to 0.

When “accidents” happen, address them immediately.  Errors are an opportunity for you to pro-actively address an issue and actually build a better relationship.


Focus on the experience
Certainly my dogs are becoming loyal because we love them.  But having fun certainly doesn’t hurt!  Every day, we make a point of playing fetch and wrestling and letting them chase the kids (in a fun way).  My shepherd and I are quickly becoming great trail-running partners. 

I’m not expecting your customers to want to chase a Frisbee, but understanding what drives your customers – when they’re not in your branch – will help you to build a better relationship.  How do you accomplish that?  LISTEN.  You need to talk to your customers about their lives, not just their banking.

Positive reinforcement
Whether you're teaching Fido to sit on command or training a customer to use their debit card more times per month, rewarding good behavior works.  You don’t necessarily need a detailed rewards program – though there are many great ones out there.  But a simple personal touch, like a hand written “thank you” note for every new account opened goes a long way.

By following these five, simple ideas, you can become the Dog Whisperer of your customer loyalty program.


Get To Your Data Faster: Announcing Shortcuts In Google Analytics

We’re pleased to announce the addition of Shortcuts to Google Analytics. Shortcuts help you get to the exact view you want of your data in GA in record time. Rather than having to go through the "find report, add segment, change, sort" process daily, with Shortcuts you can do it once, save it, and come back to it in a single click.

How to create a Shortcut


Creating Shortcuts is simple. When viewing a standard or custom report in Google Analytics, click on the “Shortcut” button found on the report’s Utility Bar:


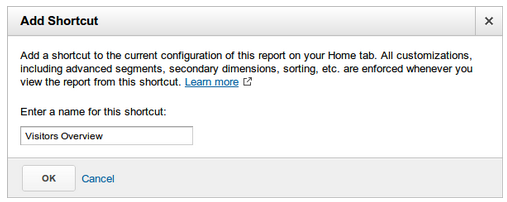
Then, give your new Shortcut a name:


Once named, you'll be taken straight to your report in the new "Shortcuts" section in the "Home" tab. Your report configuration has been stored, and your report shows up on the left side of the screen.

The following information is saved as part of a Shortcut:
  • Standard or custom report for context
  • Currently viewed tab on the report
  • Sort order
  • Advanced segments
  • Graphed metric
Notably not saved is the date range and sample size. This is because they are very dependent on the data you are looking at.

Using Shortcuts


In the "Home" tab in Google Analytics, there is a new section called "Shortcuts". Here, you can find all of the shortcuts you’ve created, and navigate to each one. Clicking a Shortcut will "reset" the segments that are applied - so you know you'll always see the same customization every time you use a Shortcut.


If you make any changes while viewing a Shortcut and you want to have those changes persist for the next time you view the Shortcut, just click on “Save” from the report’s Utility Bar:

Managing Shortcuts


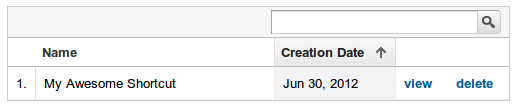
You can easily manage your Shortcuts from the Overview page, found under the Shortcuts navigation on the “Home” tab. From this page, you can also delete any of your created Shortcuts:

What else should you know?

  • Shortcuts can be emailed and exported like any other standard report.
    • Deleting a Shortcut will remove that report from any scheduled emails, as with deleting a custom report.
  • Shortcuts apply at the profile level, like the rest of reports in Google Analytics.
This is a continued step in making your experience with Google Analytics as efficient as possible. We hope you find Shortcuts a useful feature.  

Posted by Andrew Seguin, Google Analytics Team

Tuesday, August 28, 2012

Getting more local in Canada, the US, and 9 other countries

Location matters. Whether you’re running a national bank in MontrĂ©al, Canada or a contemporary fashion boutique in Brugge, Belgium, being able to target or exclude certain geographic locations with your online advertising can boost your business and save you money. Today, advertisers in Canada, the US and 9 other countries have even better local targeting options with AdWords.

Canadian Postal Code FSAs
Expanding on our launch of ZIP Code targeting in the US, Canadian Postal Code FSAs are now available for targeting. You can now reach over 1,500 Canadian Postal Code FSAs, the first three digits of the Canadian Postal Code. Now you’ll be able to plan, buy and get reporting with AdWords the same way you do with direct mail. Plus, with the “Bulk locations” tab in the AdWords location targeting tool, you’ll be able to easily enter up to 1,000 locations per country at a time.


U.S. metro changes
We've recently changed our U.S. metro targeting areas to Nielsen® DMA® (Designated Market Areas) regions. Now your online campaigns and reporting will more precisely match TV-based audience data and campaigns. If you’ve been using metros, you’ll notice that the new geographic shapes look different on a map. While you might see some increases or decreases in traffic with the new regions, we estimate the impact will be small for most advertisers.


As always, if your business has a fixed service radius and you want to more tightly target a campaign to that area, we recommend using the radius targeting option to identify and select specific cities and postal codes to reach.

More countries get city-level targeting and location extensions
We’re adding city and region targeting options in the following nine countries:
Belgium (city), Bulgaria (region & city), Denmark (city), India (city), Ireland (city), Romania (region & city), Sweden (region & city), Taiwan (city), Vietnam (city)


That brings our full list of countries with city level targeting up to 43.  

Also new to Belgium, Denmark, Ireland, India, Sweden, and Taiwan are location extensions. Location extensions show your closest business address and phone number along with your search ad, making it easier for customers to visit or call.

Put it together and win in local markets
So let’s say you are a manufacturer in India and sell through retailers in many cities across the country. You can now analyze your performance by city using the
AdWords geographic report. You might see that you're getting a better conversion rate and larger order sizes in big cities like Delhi and Mumbai. So you create a supplemental campaign just targeting Delhi and Mumbai with higher bids and distinct budgets. Next, you set up location extensions to show your local sales office locations in each city. And you use location insertion to add “Mumbai” or “Delhi” to the end of your visible URL whenever your ads show in that city to help make your business feel even more local. You’re now set up to get more clicks, conversions, visits and phone calls to help your business grow where it matters most.

Posted by Derek Coatney, Product Manager

Friday, August 24, 2012

Some Changes to DoubleClick Ad Planner

We are constantly evaluating our products to make sure that we are investing in tools that create the most value for our customers. Sometimes this requires making some changes...as we will be with DoubleClick Ad Planner. Starting on September 5, 2012, DoubleClick Ad Planner will become a tool dedicated to researching placements across the 2 million sites comprising the Google Display Network. Our goal will be to make this a best-in-class planning product for the GDN. It will also get a new name: the Google Display Network Ad Planner.

In order to maintain the highest level of quality planning data and to invest in new functionality, we will also need to discontinue some existing features. You will start to see, for example, that certain filters and demographic data will no longer be available in Ad Planner.

Next Steps
  • Please visit our Ad Planner Help Center for a full list of changes. 
  • If there is any data or media plans that you will need after this change that will no longer be available, please export and save them before September 5th. 
Thanks for your support and understanding as we continue to focus on developing new monetization features for publishers and advertisers.

Posted by Vincent Lacey, Product Manager

Combining a User Problem with a Desire to Learn: the Story of Quicklytics

This article is part of our Developer Spotlight Series that promotes new tools and applications built using the Google Analytics Developer platform. To see other tools, check out our App Gallery. Interested in having us showcase your story? Let us know what you’re working on!

Eduardo Scoz is a software architect and self-proclaimed, “analytics addict.” In early 2010, he grew frustrated with his daily routine of checking in on his web analytics from several sites and personal blogs. Very quickly he found himself spending an overwhelming amount of time monitoring his key metrics from across his own content kingdom: he yearned for a way to keep an eye on his KPI’s without having it feel like a full-time job.

Eduardo was determined to find an iPhone application that gave him a high-level view of all of his sites in way that was easy to digest. After a few days of searching he realized that the only way for him to get exactly what he wanted was to build it himself. He had never built an iPhone application but his “learn by doing” mentality prevailed: after a few weeks of prototyping, he had come up with something he was proud of. He showed it to a few friends and gauging their reaction, he realized he might be onto something. He incorporated their feedback, finished building it out and decided to release it publicly. In February 2010, Quicklytics was born.


Quicklytics allows users to rapidly check the status of multiple websites in a matter of seconds and visually understand how their site is performing for both current and historical timeframes. It has full support for both iPhone and iPad as well as custom filtering that allows for quick deep dives into areas of interest. While its primary views focus on top-level metrics, Quicklytics also provides detailed reports with most of the data also available through Google Analytics.


“All apps were about either showing as much data as possible, or focusing on less-useful stuff, like browsers and screen sizes, which are only really necessary when you’re doing deep analysis, not when ‘checking the weather’,” says Eduardo.

As soon as Quicklytics hit the App Store, it spread like wildfire. In the 2 ½ years since it was released, Quicklytics has received over 40,000 downloads - most of which were paid. This has translated into a significant source of side revenue for Eduardo’s business that has allowed him to continue building new features for Quicklytics while looking for new projects to learn from.  Now, Eduardo finds great joy in using Quicklytics to measure the mobile app analytics on - you guessed it - Quicklytics.


Quicklytics leverages the Analytics Core Reporting APIs Objective-C library and OAuth 2.0 for user authentication. Although this was Eduardo’s first experience with the Analytics APIs and Objective-C, he was able to take full advantage of the Developer Forums for support: “In the few cases I found issues with the tool, Google developers were actually very helpful and fixed some issues from their side. It was a great experience.”


Armed with a clear user problem and a willingness to learn, Eduardo was able to turn one of his biggest pain points into a viable side business and a solution that is enjoyed by many. According to Eduardo, “It’s great to know that a lot of people find it as useful as I do.”


To learn more about Quicklytics, check out his App Store listing.


Posted by John Milinovich, Google Analytics API team

SMB Hangout on Air: Special Edition


Have you ever wanted to hear directly from some of the Google teams driving AdWords product and customer service improvements? Well, here’s a great opportunity to do exactly that!

On Wednesday August 29, 2012 at 1pm PST (4pm EST), we will host a Hangout on Air to answer some of your questions and discuss recent updates that make AdWords products and customer service better for you. Our guests will be Francoise Brougher, Vice President of Global SMB Sales & Operations and Paul Feng, Director of Google AdWords Product Management joined by AdWords Certified Partners working with small and medium business advertisers: Kim Clinkunbroomer and Tom Sands, who will share their experiences and ask the panel a few questions. The live session will be moderated by Deepak Khandelwal, Vice President of Global Customer Services.

Follow the Google Ads Google+ page to watch this broadcast live on August 29th at 1:00 pm PST (4:00 pm EST). Submit your questions for Francoise and Paul by 1:00 pm PST Monday August 27th. Tune in on Wednesday for the next edition of SMB Hangouts on Air!

Posted by Agata Krzysztofik, Google Ads Team

Thursday, August 23, 2012

Multicultural Video Consumption by Mode of Delivery


How is the amount of time spent watching video divided among streaming, DVD’s, and broadcast/satellite/cable among the different cultural groups in the US?  Here we present some of the data collected by Research Now for the Florida State University Multicultural Marketing study of 2012 that answers that question.

We asked our online sample of respondents to tell us “in an average week, approximately how many hours do you spend...?” for multiple activities. The respondents were divided into those born in the US and those born abroad because that could have an impact on the language they select for their video exposure.

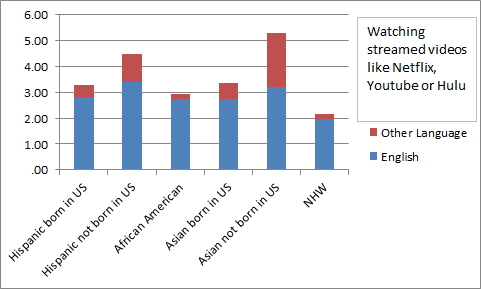
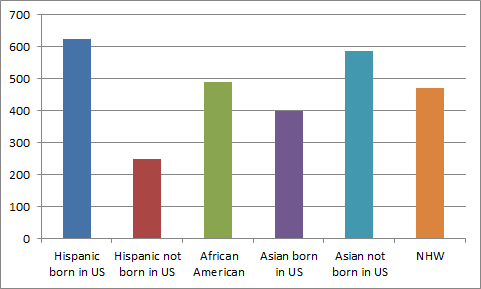
Below is the chart detailing the number of weekly hours spent watching streamed videos by different cultural groups. As can be seen streaming is most popular among Hispanics and Asians not born in the US and least among non-Hispanic Whites. Asians not born in the US report more than five hours per week watching these videos, followed by Latinos not born in the US with almost five hours per week. It may be that these groups, because of their bilingualism add more content to their routines.


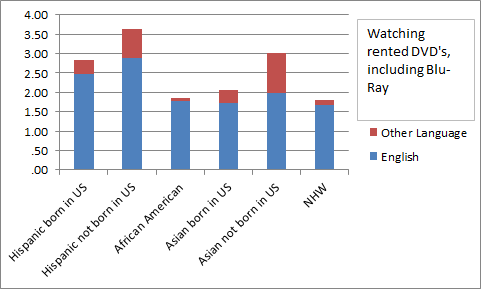
As seen in the chart below, watching rented DVD’s presents a similar pattern, but the number of hours allocated to this video delivery mode is lower and Hispanics born abroad have the highest tendency to rent DVD’s. In general, Hispanics and Asians are generally more likely to rent DVD’s than anyone else.  Perhaps the heritage of countries of origin and the availability of certain types of content account for these differences.

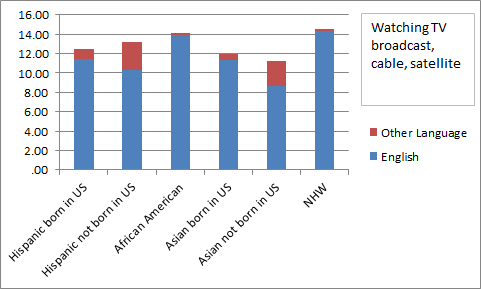
Watching TV via broadcast, cable, and satellite is still the dominant mode of video consumption as can be seen below.  

It is interesting to note, however, that those more likely to stream and rent are those less likely to watch TV in more traditional ways.  Asians and Hispanics are less likely to watch broadcast than their African American and non-Hispanic White counterparts.

These results imply that changes in video watching routines vary by cultural group and by place of birth, with the obvious implication for language preferences. Video providers like Netflix and Hulu that favor streaming are likely to be more attractive to Hispanics and Asians, particularly those born abroad. Traditional video providers like Comcast, Dish Network, and broadcast may do well in anticipating the transition that is taking place by putting more of their content online, in particular if they wish to survive in a much more competitive environment. In this new environment emerging culturally diverse groups appear to be taking the lead in enjoying newer modes of delivery.  

Cable and satellite companies may not only want to make their content available online but also they may want to reconsider how subscribers buy their content. The greater ability to choose provided by streaming and the fading DVD’s mode is not as available in cable and satellite since these companies require the purchases of large bundles of programming.

All in all, the competitive world of online video delivery seems to be hot and worthy of much attention.

The data for this study was collected by Research Now of Dallas, Texas, thanks to the generous initiative of Ms. Melanie Courtright. Research Now contributed these data to the research efforts of the Center for Hispanic Marketing Communication at Florida State University. The distribution of the sample is as follows:
This national online sample had quotas for US region, age, and gender to increase representativeness.