Showing posts with label Announcements. Show all posts

Tuesday, November 12, 2013

Launching Real-Time Events and Conversions Reports out of Beta

It wasn’t too long ago that we launched events and conversions in Google Analytics Real-Time reports. We’ve heard from many of you who are using Real-Time reporting to test changes to your site, create dashboards to monitor your traffic and goals, or make rapid decisions about what content to promote today.   

That’s why we’re excited to announce that Real-Time events and conversions reports will be coming out of Beta to all users over the next few weeks. Based on your feedback, we’ve refined these reports to make them even more valuable:  you’ll soon see them in App profiles, and we’ve also added dedicated metrics for Unique Visitors.  

Events and Conversions in App Profiles

Once the development is done, launching a new version of your app is always a bit nerve-wracking. So many problems can happen at that stage, and most of the channels for finding out that things went wrong aren’t very helpful for helping you know how your whole user base is seeing things. Wouldn’t you like to know what your users are experiencing, not just what your servers or social media are telling you? With event tracking in real-time, you can use event labels and values to measure interactions at your users’ devices, so you can best understand and respond to what users are seeing in the wild.
(Click image for full-sized version)
Perhaps your latest release adds some new social features, and you want to maximize the number of people sharing content. You can add an event to a small interaction, or a view snippet to a dedicated dialog screen. Once you’ve done that, create a goal based on that interaction, and see it show up in real-time as users help spread the word.

Unique Visitors for Events and Conversions

Google Analytics users are a creative bunch, and use events and conversions for an incredibly wide variety of things - from caffeine to detailed web interactions. We’re always doing our best to help you understand your users better, which is why we’ve added Active Visitors metrics to the Real-Time Events and Conversions reports. Sharing a link or staying on a page for several minutes is great, but it’d be even better to be able to understand what percentage of your users hit a certain event or reach a particular goal in real time.  


When you create a new advertising campaign, blog post, or social media engagement, your traffic usually goes up - but without a knowledge of how individual users behave, it’s difficult to see the quality of your traffic as it changes. By looking at Active Visitor Conversions in real-time, you can better understand your conversion funnel as it’s happening: whether users are just browsing, or whether they’re actively engaging and converting.  

We hope you find the new reports valuable! We’d love to hear how you use them - let us know in the comments. Happy analyzing!

Posted by Jon Mesh, Google Analytics team

Tuesday, November 5, 2013

Improve your website’s performance with the new Speed Suggestions report

Users prefer fast sites. And businesses benefit from it: faster sites tend to have lower bounce rates, increased customer satisfaction and better engagement. Site owners agree, and it shows in their actions taken to optimize site speed: we’re pleased to see from our own benchmarks over the last two years the web is getting faster (not only desktop, even mobile access is around 30% faster compared to last year).

Making your own site faster is something you can act on today and one of the best ways to improve user experience. To help, we’re excited to launch the new Speed Suggestions report in our suite of website performance reports. Not only can you measure and visualize the performance of your website, but you can now also speed up the slowest pages with concrete and actionable suggestions.

Speed Suggestions report


The new Speed Suggestions report shows the average page load time for top visited pages on your website and integrates with the PageSpeed Insights tool to surface suggestions for improving the pages for speed. The PageSpeed Insights tool analyzes the contents of a web page and generates a speed score and concrete suggestions.  The speed score indicates the amount of potential improvement on the page.  The closer the score is to 100, the more optimized the page is for speed.

In the report, you can click through a suggestions link to see a page with all of the suggestions sorted by their impact on site speed. Example suggestions include reducing the amount of content that needs to load before your users can interact with the page, minifying JavaScript, and reducing redirects. Note that if you rewrite your urls before displaying the url in Analytics, or your pages requires a login (see the help article for more details), then the PageSpeed Insights tool may not be able to analyze the page and generate a score and suggestions.


If you would like to dig into the which of your pages take the most time for your users to load, check out the existing Page Timings report which breaks down the average page load time for each page.  Once you’ve identified your slowest pages, you can use the new Speed Suggestions report to improve them. For more general suggestions on how to improve your website, check out these performance articles, and read more about the new report in the detailed help center article.  As always, we welcome feedback on ways to improve the report for our users.

For more help, visit our Google Developers site with tools tips and ideas on making the web faster.

Posted by Chen Xiao, Google Analytics Team

Friday, November 1, 2013

The New Dimensions and Metrics Explorer

To make it easy to navigate all the 270+ data points the Core Reporting API exposes, today we launched version 2 of the Dimensions and Metrics Explorer.


Click to see the list view.

This tool makes it easy to browse all of the dimensions and metrics, identify valid combinations, and get comprehensive definitions and descriptions.


Click to see the description view.


No wonder it’s the third most visited page on the Analytics Developer site.

Today’s update to the tool added:

  • Modes - easily see how API names map to Web View Names, and App View Names.
  • ‘Allowed in Segments’ - Quickly see which data can be used in segments.
  • Updated descriptions- See more details like data type, index ranges, UI names, deprecation status, calculations. For example, see the Custom Variables and Columns group.
  • It’s fast! - No more page loads as you browse and switch between modes.
  • Deep links - Share details of a specific dimension or metric by copying the URL of any view.
  • Automatic Updates - The Metadata API is now used to power the Dimensions and Metrics Explorer. This is a big change and means the tool will automatically update with the latest dimensions and metrics as soon as they’re released.
Visit the Dimensions and Metrics Explorer and tell us what you think.

This tool is built completely using the Metadata API. If you’re thinking about developing your own tools with this data, get started here!

Posted by Pete Frisella, Developer Advocate, Developer Relations Team

Wednesday, October 23, 2013

An Easy Way to Upgrade to Universal Analytics

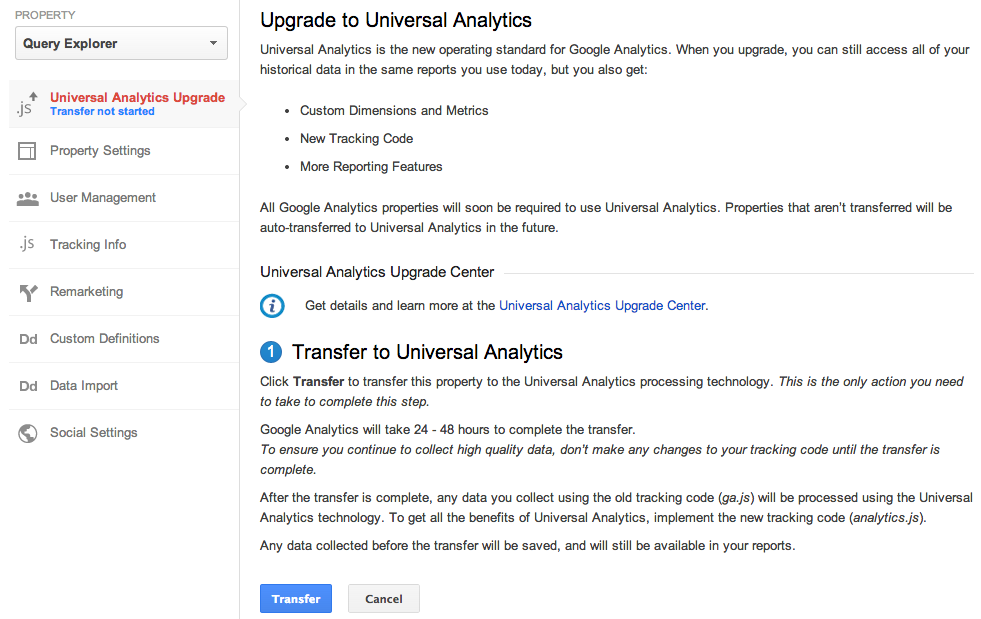
Last year we launched Universal Analytics, a new technology that allows you to measure customer interactions across platforms and devices. As we announced at the 2013 Google Analytics Summit, we’ve been working on a solution to help you upgrade your existing properties to the new infrastructure without losing any historical data.

Today, we’re announcing the Universal Analytics Upgrade Center, an easy, two-step process to upgrade your existing properties from classic Google Analytics to Universal Analytics.

Once you complete the upgrade process, you can continue to access all of your historical data, plus get all the benefits of Universal Analytics including custom dimensions and metrics, a simplified version of the tracking code, and better cross-domain and cross-device tracking support.

Getting Started

You can upgrade your classic Google Analytics properties into Universal Analytics properties by following these two steps:

Step 1: Transfer your property from Classic to Universal Analytics.
We’ve developed a new tool to transfer your properties to Universal Analytics that we will be slowly enabling in the admin section of all accounts. In the coming weeks, look for it in your property settings.


Step 2: Re-tag with a version of the Universal Analytics tracking code.
After completing Step 1, you’ll be able to upgrade your tracking code, too. Use the analytics.js JavaScript library on your websites, and Android or iOS SDK v2.x or higher for your mobile apps.

Universal Analytics Auto-Transfer

Our goal is to enable Universal Analytics for all Google Analytics properties. Soon all Google Analytics updates and new features will be built on top of the Universal Analytics infrastructure. To make sure all properties upgrade, Classic Analytics properties that don’t initiate a transfer will be auto-transferred to Universal Analytics in the coming months.

Upgrade Resources

To answer common questions, we’ve put together the Universal Analytics Upgrade Center, a comprehensive guide to the entire upgrade plan. This guide includes an overview of the process, technical references for developers, and a project timeline with phases of the overall upgrade.

We’ve also included FAQs in the Upgrade Center, but if you need more information, you can also visit the new Universal Analytics Google Group to search for answers and ask more specific questions.

We’re excited to offer you this opportunity to upgrade, and hope you take advantage of the resources we’ve created to guide you through the process. Visit the Universal Analytics Upgrade Google Group to share your comments and feedback. We’d love to hear what you have to say!

Posted By Nick Mihailovski, on behalf of the Google Analytics Team

Wednesday, October 9, 2013

Browsing, Sharing and Importing Analytics Insights Now Just A Click Away

Earlier this year, we announced the Google Analytics Solution Gallery with a collection of custom reports, segments and dashboards selected by our team to help new users get started. Today we are excited to open the platform to the public and allow any of our millions of users across the globe to share their favorite insights via the revamped Google Analytics Solutions Gallery. 


In addition to opening the platform for public submissions, we have also worked to integrate the browse, import and share functionality directly into your account via “Share” and “Import” buttons. So whether you are using your favorite dashboard to get a quick view of your site performance or working to set up a new segment, sharing and importing via the Solutions Gallery is just a click away. 


The gallery currently enables you to browse, share and import Segments, Custom Reports, Dashboards and Bundles of up to 20 perma-linkable templates. More information on how to do so is available in our help center. 

In the future, we look forward to enabling the seamless sharing and importation of everything from filters to attribution models, to custom channel groupings so keep an eye out for developments in this space and let us know what you think are the most important things to share in the comments!

Posted by Joshua Knox, Google Analytics team

New Acquisitions Reporting & Channels Shows A More Complete Picture Of Your Users & Marketing

Traffic sources in Google Analytics contains some of the most popular reports in our product and are accessed daily by millions of users. That’s why we’ve been thinking about how to evolve these reports to better present your key metrics and give you a broader view of your business. 

We know how important these reports are to you, and so we’re pleased to announce the launch of the new Acquisition reports which provide a window on your users’ Acquisition-Behavior-Conversion (ABC) cycle: how you acquire users, their behavior on your site after acquisition, and their conversion patterns. We conducted robust testing with users and saw that this setup was better for several reasons, including providing a better flow for analysis, more customization and well organized metrics.

The new Acquisitions will replace the ‘Traffic’ Sources’ section on the left hand navigation.

New reporting in acquisitions
As part of the new acquisitions we are also introducing two new reports:
  • Acquisition Overview quick summary view of traffic acquisition
  • Channels Report detailed view on a per channel basis
A more intuitive Overview report
The new overview report in the acquisition section is designed to provide you with a end to end view of how your business is operating giving you insights into how you are acquiring users, how they behave and who converts. By default, the Overview report shows you relative performance broken down by acquisition channels (more on that below). Use this report to get a quick look at:
  • Which channels acquire the most users
  • Which channels acquire users who engage most with your site
  • Which channels acquire users who result in the most conversions
Introducing channels 
Channels allow you to view your traffic acquisition at a higher level of granularity, allowing you to group similar sources using rules into logical buckets we call channels. By default all users will be pre-setup with eight channels; you can choose to customize and add more at anytime.

Channels are now a first class entity in all of analytics and will be made available in custom reports and the API soon. They are also shared across users of the same profile.

Editing the Channels
You can edit the Channels to define new channels, remove existing channels, and change channel definitions. The default Channel Grouping uses system-generated definitions for each channel. For example:
  • System Defined Channel exactly matches Direct
  • System Defined Channel exactly matches Referral
The system definitions are proprietary, and reflect Analytics’ current view of what constitutes each channel. While you cannot edit any of the system definitions, you can configure new rules to define a channel. For example, you can change the definition of the Social channel:

from:
System Defined Channel exactly matches Social
to:
Source contains plus.google.com|twitter.com

The updated reports will be gradually rolling out to all users starting today. We look forward to providing a cleaner, more intuitive experience for you and better analysis of Acquisitions.

We're thrilled with the response from users so far. Here's what Caleb Whitmore, Founder & CEO of Analytics Pros (a Google Analytics Certified Partner) had to say:
"The new Acquisition, Behavior, Conversion approach sharpens the focus for digital analysts on what matters most: how potential customers are acquired, how they behave, what their experience consists of, and last but not least, the outcomes from those behaviors - conversions.  We will benefit from the streamlined architecture and the enhanced focus on data that matters afforded by this addition to Google Analytics."
Posted by Nikhil Roy, Google Analytics Team

Thursday, October 3, 2013

See the Full Picture of Your Users in Google Play with Google Analytics for Mobile Apps

We recently re-imagined in-app analytics from the ground up, speaking the language that matters to app developers and marketers. Since launch, the insights provided by Google Analytics for Mobile Apps are already helping hundreds of thousands of app developers and marketers create more successful Android and iOS apps and experiences by measuring metrics at all stages: acquisition, behavior and conversions. 

As a follow-up from this week’s Summit, today we’re excited to announce that the integration between Google Analytics and Google Play, previewed at I/O 2013, is now available to all users! This is especially exciting for app developers and marketers because it’s the first time - and only way - to get a holistic view of the Play acquisition funnel in one easy to understand report.


The data sources you’ll be able to see include:

Google Play traffic sources: discover how marketing campaigns and search are driving installs and new users. The Google Play Referral Flow will help you refine your app marketing mix in order to focus on those campaigns and programs which are working to bring the highest quality traffic. 

Views on Google Play: understand how your app is being viewed on Google Play as the result of campaigns and search. Your description, screenshots and other content are what’s going to drive new users to install.

Installs: installs shows the number of users for each referral who actually clicked the install link for your app on Google Play. Comparing installs to views for each referral shows you if your app description and screenshots are leading to conversions. Highlight through each source further up the funnel and determine which are successful at driving downloads. 

New users: beyond installs, new users shows you how many active users actually launch your application after it’s installed. This is a key metric to see even beyond installs, reported from the Google Analytics Services SDK. Tracing the path up the funnel shows you clearly which sources don’t just account for those installing your app, but which lead to passionate users who spend time with your app leading to in-app conversions

As these reports are using flow visualization, you can also select any path you wish to analyze further which will highlight that path and present useful data points along the funnel such as drop off rate. 

To start using the Google Play Referral Flow Report, you need to simply link your Google Analytics Property to your Android app in Google Play. Linking to your app takes only seconds. 

The collaboration between Google Analytics and Google Play doesn’t end there! By linking your Analytics property to your Android app, key Google Analytics engagement metrics from your default profile will now appear inside the Google Play Developer Console. This two-way integration gives you instant access to the in-store and in-app metrics of record in whichever Google product you use. Read more on the Android Developers Blog.

These powerful new features from Google Analytics and Google Play take mobile app analytics to the next level.   

Happy Analyzing!

Posted by Russell Ketchum, Lead Product Manager, Google Analytics for Mobile Apps

New Google Analytics APIs for Large Companies

Many large companies have unique needs, with dozens of websites and many users. In the past, configuring Google Analytics for these companies was time-consuming and required too many clicks.

We're thrilled to announce a new set of APIs that will make it even easier for large companies to manage multiple websites. These APIs will streamline the Google Analytics setup process, allowing IT teams to programmatically manage and configure Google Analytics, so teams can focus their efforts on analysis and gaining insights.

Account Setup and Configuration APIs
To simplify account setup, we’ve added new APIs to manage Properties, Profiles, and Goals. This reduces the time it takes to build new account structures, and allows you to enable new features across all your existing accounts.


Note: These APIs are currently available in closed beta. Please sign up here to request access.

User Permissions APIs
To reduce the overhead in managing user access, we’ve also added APIs to manage user permissions across all your accounts. With these APIs, you can quickly list which users have access to your accounts. You can also now write programs to sync Google Analytics users with corporate directory services such as LDAP.


The User Permissions APIs are public and can be used today.

Getting Started
To get started, you can find all the API resources on our Google Analytics APIs for Large Companies page. This launch brings new opportunities to developers, IT Teams, and Google Analytics users. Let us know what you think!

Wednesday, October 2, 2013

Improve your Digital Analytics Skills with Google’s Analytics Academy

While the rapid pace of innovation in the field of digital measurement certainly keeps our work interesting, it can also make it tough to keep up with the core skills and concepts you need to be successful as a digital marketer or analyst. And, staying up-to-date on the most recent news in Google Analytics can be a big challenge for our customers and partners.

That’s why today we’re excited to announce Analytics Academy -- a new hub for you and your colleagues to participate in free, online, community-based video courses about digital analytics and Google Analytics. With Analytics Academy, we aim to provide you with a guided learning experience to become an analytics expert in no time.

Our first course, Digital Analytics Fundamentals, is open for registration now and the first lessons will be released starting on Tuesday, October 8, 2013. 

The course, hosted by Google’s Analytics Evangelist Justin Cutroni, is designed for marketers and analysts looking to understand the core principles of digital analytics and to improve their use of Google Analytics. Whether you’re looking to brush up on a few basic best practices, or are brand new to digital measurement, we think you’ll find the learning experience engaging and useful.


Each of the lessons includes an instructional video and a corresponding activity to practice the new skills you learn. You can complete the course on your own schedule during a three-week window, alongside a worldwide community of students. You’ll have the opportunity to connect with other learners and Googlers to get your questions answered by joining the course forum, the Google+ community, and Hangout on Air sessions with analytics experts.  

By the end of the course, you will have the tools and skills to create a meaningful measurement plan for your business, collect and understand your Google Analytics data, and begin doing basic analyses within the Google Analytics reports.

Sign up today and improve your digital analytics skills. Visit the course homepage to learn more and register now to become a part of this new and exciting Google Analytics learning community!

- Posted by Christina Macholan on behalf of the Google Analytics Education Team

Tuesday, October 1, 2013

The rundown: New products and features announced today at the #GASummit 2013

Every year, Google Analytics Certified Partners and Premium customers descend upon Mountain View for our annual summit. Google Analytics team members and Google thought leaders share a glimpse into the future of Analytics and our users and partners have the opportunity to network and share ideas. The 2013 theme of the Summit is Access, Empower, Act. So how does that translate to practical terms? As shared at the Summit, we want to help you do 3 things:


You heard details on how Analytics helps you accomplish each this morning in the livestream sessions from our VP Engineering Paul Muret and Product Management Director Babak Pahlavan. We also wanted to share an update of what new features were announced in case you missed anything. Following is round up of some of the cool things we're working on shared at the Summit:

Paul Muret, Google VP of Engineering, delivering opening keynote

Access

Google Tag Manager: Auto-event tracking - no more custom-code needed
Tracking events on the page has been a major pain point, both for those that use Google Tag Manager and those that don’t. Until now, if you wanted to tell Google Analytics that a user has clicked a button or submitted a form, you’d need to add custom JavaScript to the page. Launched October 1st, Auto-Event Tracking lets Google Tag Manager users listen for events on the page without adding any custom code, and then fire data to Google Analytics or other tags. This lets you deploy and iterate your measurement campaigns faster.


APIs For Enterprise
Large companies have unique needs; they have many websites and many users. In the past, it could take many hours to setup Google Analytics. With our new Google Analytics Enterprise APIs, IT teams can programmatically setup and configure Google Analytics accounts, saving time, and giving them more time to analyze data.


GA Premium SLA Expansion for Google Tag Manager
All data collection on your site requires tagging, so being able to rely on Google Tag Manager is absolutely critical to Google Analytics customers. We’re very pleased to announce that we’ll be rolling out a Service Level Agreement for Google Tag Manager to Google Analytics Premium customers in Q4 of this year. This will give Premium customers the assurance they need on the reliability of their tag management, backed by Google’s rock-solid infrastructure, as well as implementation support to get them up and running.

Empower

Unified Segments - segmentation that’s better, faster, smarter
We’ve recently re-imagined segmentation to make it even easier for new Analytics users, yet also more powerful for seasoned analysts and marketers. Updates include user segmentation, cohort analysis, sequence segments, segment templates and a fully refreshed UI. Originally announced in July, at the Summit we announced this is now available to a majority of users, and 100% by end of 2013.


ABCs (Acquisition, Behaviors & Conversions) - revamping traffic sources to be more intuitive
Acquisition in Google Analytics contains some of the most popular reports in our product and are accessed daily by active users. That’s why we’ve been thinking about how to evolve these reports to better present your key metrics in intuitive groups while improving channel flexibility. We know how important these reports are to you, and so we’re pleased to share a sneak preview of the new Acquisition reports in Google Analytics to provide a window on your users’ Acquisition-Behavior-Conversion (ABC) cycle: how you acquire users, their behavior on your site after acquisition, and their conversion patterns. They will replace the ‘Traffic’ Sources’ section on the left hand navigation.

Audience Reporting - get a deeper understanding of your users
One of the biggest challenges for online marketers is the lack of information about the people visiting their properties and buying their products. Unlike in physical stores where a manager can tell a lot about the sorts of people coming and going -- What age are they? What’s their gender? What are they interested in? -- online merchandisers and marketers are often flying blind. Audience Reporting solves this problem by providing age, gender, and interest categories as dimensions in Google Analytics. Find out who your site visitors are and gain a better understanding of who your most valuable (highest converting) audiences are so you can effectively reach your best prospects on the Google Display Network. Taking into account demographics and interests, you can efficiently target, bid, and optimize your creative to improve your campaign’s performance.


GA Premium BigQuery Integration - more granular and complex querying of unsampled data
The BigQuery integration is a feature for Google Analytics Premium that allows clients to access their session and hit level data from Google Analytics within Google BigQuery for more granular and complex querying of unsampled data. For those unfamiliar with Google BigQuery, it’s a web service that lets you perform interactive analysis of massive data sets—up to trillions of rows. Scalable and easy to use, BigQuery lets developers and businesses tap into powerful data analytics on demand. Plus, your data is easily exportable. This feature is now available for Premium users.


Analytics Academy and In-Product Help - sharpen your measurement skills


The world of digital analytics is changing fast, and we want to help analysts and marketers stay current. We’re excited to announce two new educational initiatives, Analytics Academy, is our new online learning platform (also known as a massive, open, online course or MOOC for short). We’ll be offering instructor led courses in analytics related topics multiple times a year. You can sign up for our first course, Digital Analytics Fundamentals, here. We’re also adding more help resources directly in Google Analytics. Simply access the new education window using the education button in the menu bar.


Act


Google Play integration with Mobile App Analytics: see the full picture of your app users 
We recently re-imagined in-app analytics from the ground up, speaking the language that matters to app developers and marketers. Since launch, the insights provided by Google Analytics for Mobile Apps are already helping hundreds of thousands of app developers and marketers create more successful Android and iOS apps and experiences by measuring metrics at all stages: acquisition, behavior and conversions. Today we’re excited to announce that the integration between Google Analytics and Google Play, previewed at I/O 2013, is now available to all users! This is especially exciting for app developers and marketers because it’s the first time - and only way - to get a holistic view of the Play acquisition funnel in one easy to understand report. 


As we move into 2014 and digital analytics becomes more central to how organizations of all sizes make decisions, we look forward to making our products even better. We’ll be sharing more in-depth news about each of these features over the next few months along with more details on launch dates. Stay tuned to the Google Analytics blog and follow us on Google+ and Twitter so you don’t miss a thing. 

Posted by the Google Analytics Team.

Monday, September 30, 2013

Data at your fingertips: A new version of the Google Analytics App for Android

At Google, we want to build tools that help you stay connected no matter where you are. Whether you’re in the boardroom, at a live event, or even during a day at the beach: having access to Analytics at your fingertips is important. That’s why we previously launched an Android app for Google Analytics that we’re excited has been downloaded more than 700,000 times to date.

We’ve been listening to your feedback and hear you loud and clear: the Google Analytics Android app should do more. So today we are pleased to announce the launch the latest version of the Google Analytics App for Android devices.

Visit Google Play to download and install the app to keep up with your data anytime, anywhere. Like what you see in the new version? Review it in Google Play!

We’ve added more reporting tools and enhanced the functionality of this version, so you have a first-class Google Analytics experience on every device. What’s new, specifically?
  • A completely redesigned look and feel, ideal for tablets and phones
  • New visualizations that automatically resize to fit your screen size and orientation 
  • Side navigation that mirrors Google Analytics on the web for quick access to reports
  • Specialized reporting for web and app views (profiles)
  • An Overview screen summarizing key metrics from each report 
  • Deeper analysis via dimension-based drill down in most reports
  • Better Real-Time reporting
  • Advanced Segments to further analyze your data
See an overview of your important metrics on one screen

Bringing the robust features of GA on the web to your fingertips

With the Google Analytics App, you can access all of your data - for both web and app reporting views (profiles) - so you can keep track of all of your important data with reports that are optimized for whatever device you’re using, ensuring a beautiful and intuitive experience. 

We’re also introducing new visualizations designed with tablets and phones in mind. Rather than getting overwhelmed with too much information on a small screen, you now see just the most relevant metrics on cards, so you decide when you want to drill-down for details or just get a quick update on your performance. 


We built our app using Google Tag Manager for Mobile Apps. As a result, it’s highly configurable and we can add new reports, change navigation, update visualizations all without having to update the app.  We’ve made several improvements to the app based on your feedback and have more planned, so please keep it coming. Learn more about how you can make your own apps highly configurable with GTM.

Posted by Russell Ketchum, Lead Product Manager, Google Analytics for Mobile Apps

Monday, September 23, 2013

'Access, Empower, Act' - Save the date for the 2013 Google Analytics Summit [#GASummit]

Our team is committed to keeping you at the bleeding edge of data. That's why we've continually made the content at our annual user summit more accessible. Last year we liveblogged the event on social and published a recap of key announcements. But we've heard you loud and clear: you want more. So we're excited to fulfill that request: this year, we're extending a virtual invitation to all our users.


Join us for a livestream of key sessions during our Google Analytics summit, on October 1 at 9:10a PT. Watch and hear about the future of marketing analytics from Google leadership: Paul Muret, Vice President of Google Analytics Engineering, and Babak Pahlavan, Director of Google Analytics Product Management. You will learn about new products we’re launching and hear three ways to take advantage of The Data Opportunity:
  1. Connecting the right data to the right people.
  2. Empowering every employee to analyze data 
  3. How acting on insights drives organizations forward
Set the event reminder today, and be sure and join the conversation on Google+ and Twitter using the hashtag #GASummit. 

Posted by Suzanne Mumford Google Analytics Marketing

Google Analytics earns ISO 27001 certification

With infrastructure and services that include robust data protections for all customers, enterprises like Google are able to invest in security measures that might be challenging for businesses to attain on their own.  

We’re pleased to announce that Google Analytics and Google Analytics Premium have earned the independent security standard ISO 27001 certification. As one of the world’s most widely recognized standards, ISO 27001 certifies the compliance of the systems serving Google Analytics and Google Analytics Premium.

Assurances like these provide users with additional confidence and peace of mind when they use Google Analytics.  As Rob Jackson, Head of Elisa DBI, Havas Media explains, "Our clients take data security extremely seriously. Having Google Analytics attain ISO 27001 certification further strengthens our trust in the product and that our client's data is being protected at the highest standard."

Our compliance with the ISO standard was certified by Ernst & Young CertifyPoint, a member of the International Accreditation Forum (IAF). The validity of certificates issued by Ernst & Young CertifyPoint is recognized in all countries with an IAF member.

Posted by Paul Muret, Vice President of Engineering, Google Analytics

Monday, September 16, 2013

Supporting A Modern Browsing Experience

To focus on supporting modern browsers, we are deprecating official compatibility of Google Analytics with Microsoft Internet Explorer 8 (IE8) at the end of 2013. We decided to do this to both accelerate the pace at which we can innovate new product features, and to facilitate adoption of newer web technologies in the design of the Google Analytics product. Our ultimate goal is to provide a superior user experience for every GA user. As a note, we’ll of course continue to measure traffic from IE8 browsers to your website. 

We will continue to support the latest versions of Chrome, Firefox, Internet Explorer 9 or higher, Safari and other modern browsers. 

It is our hope that giving you more than 3 months to prepare for this change will minimize disruption to Google Analytics usage for you and your business. We will send further reminders prior to the deprecation at the end of the year, but we strongly advise you begin preparing and implementing plans for this change at your earliest convenience.

Posted by the Google Analytics Team

Monday, August 19, 2013

Introducing Google Tag Manager for Mobile Apps & New Google Analytics Services SDK

Mobile Apps pose a unique set of challenges for marketers and developers. On the web, you can iterate on content and features in near-real-time and deploy conversion tracking, Remarketing, analytics and other tags to measure the effects on your users. Apps, on the other hand, are effectively frozen at the point of user install. Making even the slightest change means waiting until your next update makes its way through the various app stores and even then, you can’t be sure that all of your users will update quickly, if at all.

The surprisingly static nature of Mobile Apps creates significant problems. Forget to add an event to a key button press? Tough! Need to add conversion tracking for a last minute campaign? Too bad! Realize you need to change an important configuration setting? Sorry, not possible... that is, until now! Previewed at Google I/O earlier this year, today we're launching Google Tag Manager for Mobile Apps.


With Google Tag Manager for Mobile Apps, you instrument your app once and from then on, you can change configurations and add analytics, remarketing and conversion tracking later – without updating your app. 

Just like on the web, Google Tag Manager continues to be a free product, streamlining the process of adding “tags” to your native iOS and Android apps, making it both easy and accountable. Measuring key events is now as simple as 1-2-3:
  1. Include the new Google Analytics Services SDK (Android, iOS) in your app. This new unified SDK includes both Google Tag Manager and Google Analytics functionality while sharing a common framework.
  2. Push interesting and important events to the Data Layer. Once events are registered on the data layer, they can be used to trigger Google Tag Manager Tags and Macros. 
  3. Use Google Tag Manager’s web-based interface to write Rules and determine when various Tags should fire.

If you’re already a Google Tag Manager user, then there’s really nothing new for you to learn. The same style Tag Templates, Rules and Macros that you already know are now available for the new Mobile App Container Type. New users can get up to speed quickly, thanks to the easy-to-use web-based interface.  

Google Tag Manager for Mobile Apps natively supports AdWords Conversion Tracking, AdWords Remarketing and Google Analytics for Mobile Apps (Universal Analytics) tags. It also supports custom and 3rd party tracking events using the custom tag. For Mobile Apps, Google Tag Manager also takes things one step further using the Value Collection Macro. As we previewed at I/O 2013, developers can now create server-side configurations and use them to build highly configurable Apps. Collectively, these new features make Google Tag Manager a powerful tool for marketers and App Developers alike.  

Sign-up for your free Google Tag Manager account now and learn more about Mobile App tagging.  

Posted by Russell Ketchum, Product Manager, Google Analytics & Google Tag Manager

Thursday, August 1, 2013

Google Analytics Launches Real Time API In Beta

When we first launched Real Time Analytics 2.5 years ago we set out to enable marketers to take real-time action against their data. Manually taking action and being informed about the immediate performance of your site is fantastic, however it’s not realistic to sit at your computer 24/7 and take advantage of these insights. Also and perhaps more importantly, your reflexes can never be as fast as computers. So the next logical step has always been to programmatically take action using real-time analytics. Towards that end, we’re pleased to announce an invitation to join the beta for the Real Time Reporting API!
This means you can now make queries about your real-time data and use that information in whatever way you please. One of the immediate use cases is to manage the content on your webpage. For example, you can query the API for the top visited URLs to construct a top trending content widget with the number of active readers. A site can also use what I call the “web counter 2.0”, meaning to display the active visitor count in real-time. Seeing the number of visitors also viewing a piece of content has a number of subtle effects such as creating a sense of community and credibility. 

Additionally this metric can be shown on different conversion pages of a website to impart a sense of urgency and demonstrate demand for a given product. Twiddy, a family-owned vacation rental company, with the help of their consultant Joe Akinc, has been testing this and achieving great results. Not only did their revenue increase 18.6%, but the average order value increased 11.9% and the conversion rate increased 7.9%. See the Twiddy case study for the full story and the screenshot below for an example of how this looks visually on their search results page:


“Before Google Analytics, our site was based on the two principles of marketing: booze and guessing, It worked for Don Draper, but we weren’t that smooth. We could never figure out what was working or failing. GA was easy to install and easy to understand. Our learning curve accelerated immediately. We quickly started re-allocating resources to improve our guest experience. ” --Ross Twiddy

Other uses also include a custom executive dashboard to monitor key metrics for your business. Or check out this android app that our very own Clancy Childs built to display the number of active visitors on a pebble watch:


For developers the GA superProxy will also work well with the real-time API and Google Charts API (gviz). This enables you to publish a query that is available without authentication. This has advantages in that you can make the request client side so a widget can be written in javascript and added to a site (calling all 3rd party developers!). Additionally this acts as a cache effectively lifting your quota limits. Learn more about GA superProxy here.

We are releasing the real-time reporting API in a closed beta and there will not be an SLA enforced against the data. As such please be cognisant of this when creating anything that will be customer facing. And as always we are extremely excited to see all the creative ways that the data will be used. 

Sign up for the beta here and please feel free to send us your feedback and use cases. We will be whitelisting customers in the next couple weeks which will include further details including quota. Also be sure to check out our developer docs.

Happy Real Timing!
Posted by Linus Chou, Kasem Marifet & Ozan Hafizogullari on behalf of the Real Time Team

Wednesday, July 24, 2013

Bid Adjustment Reporting in Google Analytics

Our constantly connected world presents a great opportunity for marketers to be more effective and relevant to customers by optimizing for context -- device, location and time. Earlier this year, we launched enhanced campaigns to help advertisers take advantage of these new opportunities and manage their ad campaigns more effectively. Bid adjustments make it easy to raise or lower your bids based on user context.

To help you optimize your bid adjustments, we're introducing bid adjustment reporting in Google Analytics, allowing you to analyze performance for each of your bid adjustments across devices, locations, and time of day. You can access the new report by going to Traffic Sources > Advertising >AdWords and clicking the Bid Adjustments link.


With the new Bid Adjustments report, you can take advantage of the full range of visitor metrics available in Google Analytics to optimize your bid adjustments. This provides a window into your users’ behavior, allowing you to optimize bid adjustments based on behavior & goal conversion data like bounce rate and time-on-site.

In addition, with Ecommerce tracking enabled in GA, you can now use this data to fine-tune your bid adjustments in AdWords based on the actual revenue generated, instead of conversions. This means you can optimize for ROI instead of CPA goals.

A quick example illustrates this (illustrated in the above screenshot). Imagine a hotel chain has set Time bid adjustments of +20% on Saturday and Sunday after observing a better ROI on those days. Using this new report in GA, the hotel chain now observes that their ROI on Sundays is actually higher than on other days of the week. The hotel chain's analyst finds that customers book more expensive rooms and longer stays on Sundays. Using this information, the hotel chain increases its existing Time bid adjustment for Sundays.

This new bid adjustment report is available in all Analytics accounts that are linked to AdWords. We recently made it much easier to link your accounts, so now is a great time to do so if you haven’t already. 

Posted by Nikhil Roy, Product Manager, Google Analytics Team

Tuesday, July 16, 2013

Re-imagining Segmentation In Analytics To Help You Make Better Decisions, Faster

One of the most popular and powerful features in Google Analytics is Advanced Segmentation. It lets you isolate and analyze subsets of your traffic. You can select from predefined segments such as "Paid Traffic" and "Visits with Conversions" or create your own segments with a flexible, easy-to-use segment builder. Then, you can apply one or more of these segments to current or historical data, and even compare segment performance side by side in reports. 

We’ve recently re-imagined segmentation to make it even easier for new Analytics users, yet also more powerful for seasoned analysts and marketers.

Some of the key updated features include: 

User segmentation
Previously, advanced segments were based on visits. With the new segment, a new option is provided to create user segment. In a user segment, all visits of the users who fit the segment criterias will be selected (such as specific demographics or behaviors). It will be a useful technique when you need to perform user level analysis. 

When you are using a segment template, the text below the template name tells you which kind of segment you are building. When you are creating a segment from advanced ‘conditions’ and ‘sequences’, you can choose to create visits or user segments or even a combination of both. 

Cohort analysis
Measuring users in cohorts provides benefits in the consistency of analysis, and is a technique well applied in the offline world. It helps analyze the long-term benefit of specific groups of customers (for example, customers who first visited within a specified timeframe).


Sequence segment
Sequence segments provide an easy way to segment users based on a series of on site behaviors. For example, customers who started on a specific landing page, visited some particular pages and ended up converting.  User sequences now provide you with capability to define a sequence across multiple visits.

Segment templates
You can always build your segments from scratch, but for most common use cases, building segments from templates will be an easier choice. We have provided 6 templates as ‘Demographics’, ‘Technology’, ‘Behavior’, ‘Data of First Visit’, ‘Traffic Sources’ and ‘E-commerce’ for you to start with. You can combine the configuration in multiple templates to build a segment. 

Fully refreshed new UI
As seen above, the newly refreshed UI makes segmentation simple and makes this powerful feature even more useful. The new segment card design promotes segmentation as a critical analytics technique with better visibility and readability. For users maintaining a fair number of segments, new features are provided to filter, sort and search your segments in both grid view and list view.


The new segmentation version will be rolling out to all users over the next couple of months. View our help center article for more details on how to get started and check out our Analytics Evangelist Justin Cutroni’s blog for a post sharing more reasons to get excited about the new segmentation.

Additionally, the below video provides a quick overview:


Posted by Wayne Xu, Google Analytics team