- Measuring in-store purchases and tying purchases to your online data
- Understanding behaviour across any connected device, including gaming consoles
- Comparing offline billboard impressions to online display ad impressions
- Getting insights into your audience’s online to offline journey
Friday, December 13, 2013
Using Universal Analytics to Measure Movement
Thursday, November 21, 2013
New Secondary Dimensions Provides Deeper Insights Into Your Users
Custom Dimensions is a new Universal Analytics feature that allows you to bring custom business data into Google Analytics. For example, a custom dimension can be used to collect friendly page names, whether the user is logged in, or a user tier (like Gold, Platinum, or Diamond).
By using Custom Dimensions in secondary dimensions, you can now refine standard reports to obtain deeper insights.
In the report above, Direct Traffic delivers the most traffic, but these are Gold users (lower value). At the same time, Google Search delivers the third and fourth most site traffic and these are Diamond users (high value). Therefore, data shows this site should continue to invest in Google Search to attract more high value users.
The new data in secondary dimensions gives analysts a powerful new tool. We’d love to hear about any new insights in the comments.
Posted by Nick Mihailovski, Product Manager, Google Analytics API team
Friday, November 1, 2013
The New Dimensions and Metrics Explorer
To make it easy to navigate all the 270+ data points the Core Reporting API exposes, today we launched version 2 of the Dimensions and Metrics Explorer.
This tool makes it easy to browse all of the dimensions and metrics, identify valid combinations, and get comprehensive definitions and descriptions.

Click to see the description view.
No wonder it’s the third most visited page on the Analytics Developer site.
Today’s update to the tool added:
- Modes - easily see how API names map to Web View Names, and App View Names.
- ‘Allowed in Segments’ - Quickly see which data can be used in segments.
- Updated descriptions- See more details like data type, index ranges, UI names, deprecation status, calculations. For example, see the Custom Variables and Columns group.
- It’s fast! - No more page loads as you browse and switch between modes.
- Deep links - Share details of a specific dimension or metric by copying the URL of any view.
- Automatic Updates - The Metadata API is now used to power the Dimensions and Metrics Explorer. This is a big change and means the tool will automatically update with the latest dimensions and metrics as soon as they’re released.
This tool is built completely using the Metadata API. If you’re thinking about developing your own tools with this data, get started here!
Posted by Pete Frisella, Developer Advocate, Developer Relations Team
Wednesday, October 30, 2013
Measuring Twitter with Universal Analytics


![]() |
| (click image for full-sized version) |
![]() |
| (click image for full-sized version) |
![]() |
| (click image for full-sized version) |
Posted by Aditi Rajaram, Google Analytics Team
Monday, October 28, 2013
New AdSense Data in the Core Reporting API
In the past, accessing AdSense data using the Analytics Core Reporting API has been a top feature request. We’ve now added 8 new AdSense metrics to the Analytics Core Reporting API, enabling publishers to streamline their analysis.
You can now answer the following business questions using these API queries:
dimensions=ga:pagePath
- Magic Script: A Google Spreadsheets script to automate importing Analytics data into Spreadsheets, allowing for easy data manipulation. No coding required!
- Google Analytics superProxy: An App Engine application that reduces all the complexity of authorization.
Posted by Nick Mihailovksi, Product Manager, Google Analytics API Team
Wednesday, October 23, 2013
An Easy Way to Upgrade to Universal Analytics
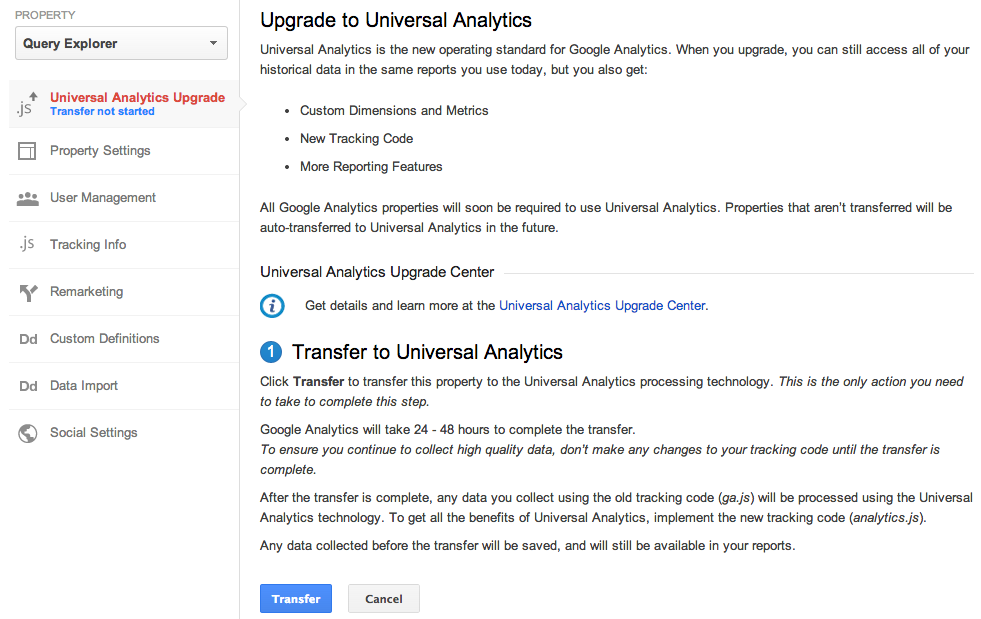
Today, we’re announcing the Universal Analytics Upgrade Center, an easy, two-step process to upgrade your existing properties from classic Google Analytics to Universal Analytics.
Once you complete the upgrade process, you can continue to access all of your historical data, plus get all the benefits of Universal Analytics including custom dimensions and metrics, a simplified version of the tracking code, and better cross-domain and cross-device tracking support.
Getting Started
Step 1: Transfer your property from Classic to Universal Analytics.
We’ve developed a new tool to transfer your properties to Universal Analytics that we will be slowly enabling in the admin section of all accounts. In the coming weeks, look for it in your property settings.
Step 2: Re-tag with a version of the Universal Analytics tracking code.
After completing Step 1, you’ll be able to upgrade your tracking code, too. Use the analytics.js JavaScript library on your websites, and Android or iOS SDK v2.x or higher for your mobile apps.
Universal Analytics Auto-Transfer
Our goal is to enable Universal Analytics for all Google Analytics properties. Soon all Google Analytics updates and new features will be built on top of the Universal Analytics infrastructure. To make sure all properties upgrade, Classic Analytics properties that don’t initiate a transfer will be auto-transferred to Universal Analytics in the coming months.Upgrade Resources
To answer common questions, we’ve put together the Universal Analytics Upgrade Center, a comprehensive guide to the entire upgrade plan. This guide includes an overview of the process, technical references for developers, and a project timeline with phases of the overall upgrade.We’ve also included FAQs in the Upgrade Center, but if you need more information, you can also visit the new Universal Analytics Google Group to search for answers and ask more specific questions.
We’re excited to offer you this opportunity to upgrade, and hope you take advantage of the resources we’ve created to guide you through the process. Visit the Universal Analytics Upgrade Google Group to share your comments and feedback. We’d love to hear what you have to say!
Posted By Nick Mihailovski, on behalf of the Google Analytics Team
Tuesday, October 15, 2013
New Sample Size Control and Relative Dates Features in Google Analytics APIs
To make things easier, we’ve added support for relative dates! You can now specify NdaysAgo as a value of either the start or end date. So the date range of the last 14 days from yesterday can now be expressed as:
start-date=15daysAgo&end-date=yesterday
Using these values will automatically determine the date range based on today’s date, allowing apps to always display the data for last 14 days (or whatever time period you’d like!).
Sample size control
Second, we added 2 new fields to the API response:
- sampleSize - The number of samples that were used for the sampled query.
- sampleSpace - The total sampling space size. This indicates the total available sample space size from which the samples were selected.
Posted by Nick Mihailovski and Srinivasan Kannan, the Google Analytics API Team
Thursday, October 3, 2013
New Google Analytics APIs for Large Companies
Posted by Nick Mihailovski, Product Manager, Google Analytics team
Thursday, August 22, 2013
Google Analytics on Google Developers Live
We'll be doing these a few times a month, on Thursdays at 10AM PDT (full schedule here). Each show is about a half hour.
The show will either take you “Behind the Code” or “Off the Charts.” Off the Charts is a series about getting into the deep features of Google Analytics, understanding how it works, things you can do with it and how to use the feature itself. “Behind the Code” will not only showcase new GA features and technology, but also take us behind the scenes and give you a chance to hear directly from some of the engineers, product managers, and others who work behind the scenes to design, build, and deliver these new features.
Here’s some of our favorites from the past:
Off the Charts: Google Analytics superProxy
Google Analytics superProxy is an open source project developed by the Google Analytics Developer Relations team. Join Developer Advocate Pete Frisella to learn how to use this application to publicly share your Google Analytics reporting data and power your own custom dashboards and widgets.
Behind the Code: Analytics Mobile SDK
The new Google Analytics Mobile SDK empowers Android and iOS developers to effectively collect user engagement data from their applications to measure active user counts, user geography, new feature adoption and many other useful metrics. Join Analytics Developer Program Engineer Andrew Wales and Analytics Software Engineer Jim Cotugno for an unprecedented look behind the code at the goals, design, and architecture of the new SDK to learn more about what it takes to build world-class technology.
Don’t forget to check out next week’s show (8/29, 10AM PDT) on the recently launched Metadata API, which contains all the dimensions and metrics that you can query with in Google Analytics Reporting APIs. We’ll be discussing how you can use this API to to simplify data discovery. Tune in here!
Posted by Aditi Rajaram, Google Analytics Developer Relations team
Wednesday, August 21, 2013
Introducing The New Google Analytics Metadata API
Google Analytics users can use the Core Reporting API to save time by building dashboards and automating complex reporting tasks. This API exposes over 250 data points (dimensions and metrics), and new data is added every few months. For many developers, it can be difficult to keep their applications up to date with all the latest data.
To make things easier, today we are launching the new Google Analytics Metadata API to simplify data discovery. The Metadata API contains all the queryable dimensions and metrics included in the Core Reporting API. We’ve also added attributes for each dimension and metric, such as the web or app name, full text description, grouping, metric calculations, deprecation status, and whether the data is queryable in segments. You can check out at a live Metadata API response here.
You now have programmatic access to generate the same list of dimensions and metrics we use to generate our public documentation.
Saving Developers Time
When you create tools to query the Core Reporting API, you can use the Metadata API to automatically update your user interfaces. For example, Analytics Canvas, a popular 3rd party Google Analytics data extraction tool, uses the Metadata API to keep its query building interface up to date.
According to James Standen, founder of Analytics Canvas, "In the past, keeping Analytics Canvas up to date with the Google Analytics API dimensions and metrics required a lot of manual updating to our application. The new Metadata API automates this process, saving us time, and giving our users direct access to all the great new data the instant it's available. Users love it!"
New Deprecation Policy
To increase data transparency, we’ve also published a new data deprecation policy for dimensions and metrics. New data we release will be announced on our changelogs and automatically added to the Metadata API. Data we decide to remove will be marked as deprecated in the Metadata API, allowing developers to gracefully remove these values from their tools.
Get Started Today
Our goal was to make this API super easy to use. To get started, take a look at our list of resources below:
- Read the Metadata API Reference guide to learn how to use the API data in your application.
- Read the Metadata API Developer guide to learn how the API can be used to solve common use cases.
- Join us for our Google Developers Live show on the Metadata API, Thursday August 29th at 10am PDT / 5pm UTC.
Questions? Comments? Simply want to share in the excitement? Join the analytics developer community in our Reporting API Developer forum.
Posted by Nick Mihailovski & Srinivasan Kannan, Google Analytics API team
Thursday, August 1, 2013
Google Analytics Launches Real Time API In Beta


Tuesday, July 9, 2013
40 New Data Points In Google Analytics API
Over the past year we’ve added many new features to Google Analytics. Today we are releasing all of this data in the Core Reporting API!

Custom Dimensions and Metrics
We're most excited about the ability to query for custom dimensions and metrics using the API.
Developers can use custom dimensions to send unique IDs into Google Analytics, and then use the core reporting API to retrieve these IDs along with other Google Analytics data.
For example, your content management system can pass a content ID as a custom dimension using the Google Analytics tracking code. Developers can then use the API to get a list of the most popular content by ID and display the list of most popular content on their website.
Mobile Dimensions and Metrics
We've added more mobile dimensions and metrics, including those found in the Mobile App Analytics reports:
- ga:appId
- ga:appVersion
- ga:appName
- ga:appInstallerId
- ga:landingScreenName
- ga:screenDepth
- ga:screenName
- ga:exitScreenName
- ga:timeOnScreen
- ga:avgScreenviewDuration
- ga:deviceCategory
- ga:isTablet
- ga:mobileDeviceMarketingName
- ga:exceptionDescription
- ga:exceptionsPerScreenview
- ga:fatalExceptionsPerScreenview
Some examples of questions this new data can answer are:
- What is the behavior (e.g. avg time on site) of tablet vs. non-tablet visits?
- Which versions of my app are getting the most usage?
- Which screens are generating the most exceptions, and for which app version and OS combination?
Local Currency Metrics
If you are sending Google Analytics multiple currencies, you now have the ability to access the local currency of the transactions with this new data:
- ga:currencyCode
- ga:localItemRevenue
- ga:localTransactionRevenue
- ga:localTransactionShipping
- ga:localTransactionTax
Time Dimensions
We also added new time based dimensions to simplify working with reporting data:
- ga:dayOfWeekName
- ga:dateHour
- ga:isoWeek
- ga:yearMonth
- ga:yearWeek
Sample queries:
Traffic Source Dimensions
Finally, we've added two new traffic source dimensions, including one to return the full URL of the referral.
- ga:fullReferrer
- ga:sourceMedium
Sample query: the top 10 referrers based on visits (using full referrer).
For a complete list of the new data, take a look at the Core Reporting API changelog.
For all the data definitions, check the Core Reporting API Dimensions and Metrics explorer.
As always, you can check out this new data directly within our Query Explorer tool.
We’re very excited to release this data and thrilled to see what developers build next!
Posted by Srinivasan Kannan & Pete Frisella, Google Analytics API Team
Tuesday, June 4, 2013
Google Analytics Becomes A Robust Testing Platform With Content Experiments API


Tuesday, March 12, 2013
Get Useful Insights Easier: Automate Cohort Analysis with Analytics & Tableau
- What traffic channel yields the most valuable customers (not just valuable one time conversions)
- Customer life time volume based on their first bought item (or category)
- Methods for gaining and retaining customers and which groups of customers to focus on
- For content and media sites, understanding frequency, repeat visitors and content consumption after sign up or other key events
- Repeat Purchase Probability
- From the Tableau home screen, select Connect to Data, and then pick the Google Analytics connector. After authenticating to Google Analytics, you'll be prompted to select your Account, Property and Profile, if you have access to more than one.
- Set up the data import to get your Custom Variable key (e.g. CV1) and Date as dimensions, and Revenue as a Metric.

- Change the format from Google's 20130113 to a Tableau DATE format. Since the date was stored in a custom variable, it was stored as a string. So that Tableau can treat this as a date, we need to convert the string to a date format. This was done by creating a new Calculated field in Tableau. We called the field "Cohort Date". The formula below worked for our purposes but would require some tweaking for larger datasets.

- Now that we have the date in the format we want, the next step is to subtract the cohort date from the transaction date. To do this, we created another calculated field called "Days since Signup". The formula for this field was simply:
- Drag the Revenue measure to the rows Rows tab. Now drag the Days since Signup to the Columns tab. You should see a long graph similar to:

- Drag the Cohort date to the Filter pane, and select the cohort dates you'd like to visualize. For ease of use, I suggest, select only a few to begin with. Drag the Cohort to the color shelf to enable color coding of individual cohort dates.
- Now let's make a couple of adjustments to make the visualization more useful. In the color shelf, click the down arrow next to Cohort Date, and change the default display from Continuous to Discrete. Then, in the same field, select Exact Date instead of Year.