Tuesday, March 31, 2009

Marketing Optimization with Google Analytics

Improve ROI from Shopping Comparison Sites

These days, I'm getting a lot of clients who want to increase their ROI on referral site campaigns. We'll explore this topic by talking specifically about shopping comparison sites. The same techniques are generally applicable to all kinds of referring sites. My goal is to help you track and identify the referring sites that bring you quality traffic and generate more business and profit.

We'll explore:

  • How to identify shopping comparison sites in Google Analytics reports.
  • How to assess revenue generated by each of the sites.
  • How to export your Google Analytics data and merge it with cost data.
  • How to analyze to identify winners and fix under performers.

Identify Shopping Comparison Sites in Google Analytics Reports

To identify the sites in question, check with your marketing team and get a list of all the shopping comparison sites you use. This sounds like an easy step, but sometimes it takes a lot of back and forth with your marketing team to get the complete list. In this list, you should see some common names such as NexTag, BizRate, Shopzilla, PriceGrabber, DealNews, and Shopping.com. There might be other sites that are not as common but may be applicable to your vertical, so look for those too. You could also include other sites in this analysis such as Yahoo! Shopping if you have your products listed there.

Let's get started!

Say your site gets traffic from NexTag, BizRate, Shopping.com, and Yahoo! Shopping. In Google Analytics, go to Traffic Sources, click on Referring sites, and then use this inline filter to quickly look at the sites you want to analyze:

You can examine time on site, bounce rates, and other readily available metrics.

If you like to review this report frequently, and you should if you are spending a lot of money on these sites, you can create an advanced segment with "Referral" as the medium and then list your comparison sites as the sources.


Assess Revenue Generated by Each of the Sites

In the same Traffic Sources/Referring Sites area, you can next click on the Ecommerce tab and get a full picture of revenue and conversion rates.

In this report, and for this specific site, you'll see that although NexTag generates a lot of visits, its conversion rate, 1% is less than half of BizRate which is 2.32%. You can also see that shopping.com did very well with a conversion rate of 2.94%. Traffic from shopping.com seems to outperform the rest as it has the highest conversion rate and also the highest average order value.

So far these reports are very helpful in providing easy access to how each source is performing and the revenue it is generating.

There is still one thing that is missing though - cost data! There is a cost in bringing these visits to the site, and what if the cost of listing our products on these shopping sites is higher than the revenue being generated? I would think that a ninja analyst as well as a novice analyst would definitely want to include cost data and ROI in their reports. After all, you are in business to make money, not just to improve conversion rates!


Export your Google Analytics Data and Merge it With Shopping Sites Cost Data

For now, Google Analytics doesn't allow importing cost data into its reports (except for Adwords), so we will export the GA data and merge it with the shopping sites cost data in a spreadsheet.

Step 1: In the above report (Traffic Sources/Referring Sites, with your sites filtered), click on the "Export" button, choose the CSV format, and save the file

Step 2: Get your cost data from your respective shopping comparison sites.

Step 3: Using Excel or a Google spreadsheet, open the CSV file and, insert your cost data, and run your ROI calculation

For our analysis below, the client has indicated that to make money (profitably) they can't afford to spend more than 25% of their revenue on advertising. So we created the Return on Ad Spend table below taking into account the client provided business metrics. (you can view this table at the following link: http://spreadsheets.google.com/ccc?key=pkrS9PTOkmimeBKiGJ3oZMQ)


Analyze to Identify Winners and Fix Under Performers

  • It is clear from the table above which sites are profitable, namely sites#2 and #4. Both had a less than 25% of Ad Spend/Revenue ratio.
  • It is also clear that the site with the highest conversion rate, site#1, might not be profitable at all!
  • What actions can be taken?
    • See how you can get more of the high quality traffic from sites#2 and #4.
    • Immediately investigate site#1's traffic because it is a top spender with an unacceptable ad spend ratio.
    • Once you are done with the above, start examining the other under-performing sites.
    • You can also look into average order value and create a different ROI baseline it. Maybe it is OK to spend more on advertisements for sites that bring a higher average order value.
  • What could be causing such bad return on sites#1 and #3?
    • Mismatch between product listed on the shopping site and product listed on your landing page.
    • Mismatch in pricing: you advertise one price on the shopping site and when visitors come to your site, they find a higher price.
    • Ineffective bidding strategy: you are paying too much for clicks on your listed products.
    • Site related issues such as slow load time.
    • Seasonality. For example, I'm sure Christmas ornaments aren't hot sellers in the peak of summer.

A few other comments:

  • When analyzing sales/conversion/ROI, ensure that you have all data elements included. For example, if your online business allows for phone orders, you then would want to ensure that phone order revenue and cost data are all appropriately attributed to their original sources. This is much easier said than done but there is tremendous value in doing it!
  • Averages often don't tell the complete picture, so digging deeper into the data of each site and its categories is likely to reveal even better insights.
  • The above analysis is done for a one-time period. You would want to trend this data daily, weekly and/or monthly and watch for external factors as well. For example, a weak economy is likely to have a negative impact on sales across the board.

To summarize:

  1. Look for opportunities to get more out of what you are spending. Don't let your comparison shopping site ad spend be set on auto-pilot.
  2. Track and analyze on-site metrics including revenue by referring site.
  3. Take one more step: merge your cost data and run your ROI calculations to find what is profitable and what is not.
  4. Act on your findings!

Related Posts

Carpe Diem


Is it possible?  Is there a light at the end of the recession tunnel?  

A slew of economic reports released last week may be hinting at some possible good news.  Out of 12 reports released last week, 7 were better than expected and 2 met expectations.  And investors responded by sending the stock market to a healthy gain last week.

Heck, I watched the news last night and hardly saw anything bad about bankers!!!

The point is that as the economy begins to turn a corner, so will the public eye and focus.  As your community's hometown financial institution, have you done everything you can to capitalize on the mistrust and negative perceptions of the larger banks?

Soon J-Lo or A-Rod or some other far too wealthy person who doesn't use their whole name will do something stupid and, as Americans, we'll focus on the next shiny object that comes along.  People will forget that big banks "are bad," and then the large banks with their enormous marketing budgets will begin to gobble up market share again.

Seize the day, fellow community bankers and credit unioners!  Don't wait.  Get your piece of the market share pie while we still have a competitive advantage!

Happy Trails,
Eric

Monday, March 30, 2009

Rich Media and Video templates in display ad builder

Today, we're making it simpler to bring richer content, interaction and tracking to your online display ads with our new Rich Media and Video templates in the AdWords display ad builder. These templates allow you to add more functionality to your ads, enabling users to interact with your ads before they click through. Here's what you can do with these new templates:
  • Show off multiple products and services: If you're providing many products and services, the new templates allow you to display multiple products within your ad. This feature can also benefit advertisers looking to brand by allowing them to tell a sequential story within the ad, such as "Explore, Buy, Save," where you could have an image representing each concept.
  • Use multiple destination URLs: If you're displaying multiple products within your ad, the new templates allow you to assign a different destination URL to each featured product, rather than directing users who click to a single, generic page that may be less targeted. This can help improve conversion rates, making your marketing more cost-efficient. Note that all the top-level domains of each destination URL within an ad must match.
  • Track interactions: Like with all our display ad templates, you'll automatically see a reporting column,"Mouseover rate," which shows the percentage of impressions where a user moused over your ad for one or more consecutive seconds. In addition, some rich media and video templates will track unique interactions, like the play rate for video ads; these will be displayed in a new "Interaction Rate" column. The actual interaction being tracked will vary based on the template you've chosen.
  • Use video: If you have video ad files, you can upload them to our new Click to Play video template, which allows you to choose starting and ending images, pick a display URL color, and run your ads across the Google Content Network.
  • Get creative: Last week, we announced new coupon templates, which allow you to set discounts and change prices within your ad. You can use these templates in the same way, offering multiple discounted products and allowing users to choose those that most interest them. Along with each image in your ad, you can include an accompanying description line that you can use to provide coupon codes, prices, and product information. This is just one of many ways to think and market "outside the box" with these rich media and video templates.
All this is easy to do in just minutes, and this video can show you how:


If you have trouble watching the video, you can watch it here.

You can access the new templates within your AdWords account by choosing the "Display ad builder" ad format option within any ad group and selecting the "Rich Media and Video" category.

We hope these new templates will give you one more great reason to try out the AdWords display ad builder, and reach additional customers in new ways.

Back to Basics: Control access to your data

Many Google Analytics account owners give people access to their account (e.g. account manager, clients, staff members) in order to get help with managing their account or interpreting the data in their reports.

Luckily, the User Manager feature in Analytics prevents you from giving out your user name and password to dozens of people – which means no worrying about people poking around in your account settings without your knowledge. User Manager lets you easily give and take away different levels of account access to anyone you want.

Administrator
This level of access gives full privileges to your account. Administrators can change settings, such as adding (or removing) profiles, users, filters and goals. They can also give other people access to your account. Please note that administrators have control over all profiles and reports in your account.

Reports access
This access level gives a person the ability to view reports, but he or she won't be able make any changes to the account. Reports access users can be further restricted to view reports by specific profiles by the Administrator.

The video below walks through the process of adding or editing user-level access to your account.


Friday, March 27, 2009

Financial Literacy and Bankers

Everywhere you look these days there is more evidence of the crisis. But I am not talking about the Wall Street crisis, I am talking about the crisis in our country's financial literacy. Consumer debt levels are astronomical, our country's savings rate has been at 0% for several years, and Suzy Orman and Dave Ramsey can't talk fast enough.
As we look around us, we as Bankers must raise our hands and admit some guilt here. As an industry and as individual banks or credit unions, we have done a lousy job of counseling our customers on basic financial topics.
For example, when a young single who is just starting out on their own comes in to open their new accounts, do we help them in all the right ways? Do we talk to them about saving 10% of their take-home pay? Or advise them on the importance of their credit report and give them some tips on how to protect it? Something as simple as saying, "You know, if you set up your minimum payment for your credit card as an automatic payment online, you will never be late. This not only saves you late fees and interest rates as high as 36%, but protects something even more important.... your credit score." Usually, we just take the credit card application and don't mention anything about using it wisely.
How many times when people say they don't have a savings account do we offer some friendly advice, as their banker and friend, that they really should put away some money every payday... and that we can help them get it set up to come directly out of their paycheck and go into their savings account...? Not to mention how boring most of our savings options are-that's a topic for another day!
These examples are just for the young people who need to get a firm financial foundation started so they can experience financial success throughout their lives. But we don't train our employees to do this. We don't require them to help all of our customers at the level that they really need.
This wouldn't be such a problem if people got financial education elsewhere... but where are they to get it?
Obviously, the parents don't necessarily know it or pass it down. Some high schools teach it; some states require it.... but most states do not. In those states, the kids who take consumer education are few, as resources and teachers are not always available. Even most college graduates have never had a course in financial education.
Isn't it time that as bankers, we start to take some responsibility for teaching our customers some basic financial principles? Do we really just care about "making the sale" or "cross-selling"? At Market Match, we include financial counseling in our cross-sell training series, the Winning Team. But I am curious if any of you out there are using other programs or materials to ensure that your employees are prepared to have deeper conversations with your customers? Please email me at slovejoy@marketmatch.com and let me know if you are a leader in this area of financial literacy.
I believe, as a Banker, that we can do better.

Thursday, March 26, 2009

Beta expansion: Try the new AdWords interface

Back in November, we asked a small group of U.S. advertisers to start testing a new web interface for AdWords while it was still early in development. The new interface makes AdWords campaign management faster, clearer, and more intuitive. This means it's easier to find your most important keywords across ad groups, navigate and edit your account quickly, and access and act on your reports.

We've continued to work on the new interface for the last few months, making changes based on feedback from beta testers. Now we're excited to expand the beta to more U.S. advertisers, as well as additional countries (such as the U.K. and Australia), and languages (such as Spanish, Japanese, French, and Brazilian Portuguese).

Here are a few of the exciting features we're testing:
  • Performance graphs: Spot trends over time with custom graphs on every campaign management page.
  • Insight across ad groups: Focus on the high-impact areas of your account with new roll-up tabs on every page. You can see and edit keywords, placements or ads from all ad groups on a single tab.
  • In-line editing: Want to change a keyword or bid? Click on it and make changes in-line instead of loading a separate page.
  • Easier content network management: Improve content network performance through a new Networks tab. Look at statistics for the placements where your ads have appeared, and then take action by setting unique bids or excluding placements directly from the report.
However, keep in mind that the new interface doesn't change how ads run. Bidding, ranking, Quality Score, and the rest of ad serving will remain the same in the new interface.

The new interface is still a work in progress, so not all features available in the previous web interface are currently supported. You can switch between old and new interfaces during the beta, so you'll still have access to the full range of AdWords tools and reports, if needed.

To learn more, see videos of the new interface in action, and sign up for the beta, visit our new AdWords interface website.

Wednesday, March 25, 2009

Google Analytics Cake

Umm... delicious. Nice work Tim and Clarkson!


Find out how he made it.

Tuesday, March 24, 2009

Using Google Analytics to Create an Optimization Plan

Let’s face it, your website is never really finished. Testing pages is an inexpensive way to manage a constantly shifting audience and market. It's great for:
  1. Increasing ROI on your advertising
  2. Teaching you about the likes and dislikes of your customers
  3. Trying out alternatives used by competitors
  4. Breaking down preconceptions about what works
  5. Convincing a stubborn boss to try something new

What and where to test?

So where do you start? First you need a goal. What do you want users on your site to do? Complete a form, buy something, sign up for a newsletter? Without a goal, it's difficult to optimize, so you should be sure to define one if you haven't already.

Once you have a goal, you can use Google Analytics to identify those pages that are having the biggest negative impact on the total number of people "converting," or achieving that goal. These are the pages to test.

Top landing pages report

(Content > Top Landing Pages)

This report gives you instant insight into how well (or poorly) your landing pages are performing. You want to find pages that have both high "entrances" and a high "bounce rate." These pages are costing you a lot of visitors.


Goal visualization report

(Goals > Funnel Visualization)

The funnel visualization in Google Analytics shows you where people leave during your buying process. For example, the below report shows that 40% of the 200 potential buyers left during "Step X" in the checkout process. Average order value is $100. This means the merchant is losing up to $8,000 in revenue every month due to "Step X."


Exit pages

(Content > Top Exit Pages)

With this report, you should look for pages that are designed to sell, but have high exit rates. Using the top content report, I see that my product pages have a 35% exit rate. These pages are supposed to persuade potential customers to add products to the shopping cart, so they would be good candidates for optimization.


Having looked at these reports, there's a fair chance you've found high-impact pages that perform below average. If not, you can take a look at the "top content" report and pick a few pages that see a lot of traffic, but are poorly designed or out-of-date.

Setting up a test with Google Website Optimizer

Google has a free tool to test you pages called Google Website Optimizer. Find out more here .

Here are a few tips for using Google Website Optimizer and Google Analytics together:

  1. Make sure you get to see your variances in Google Analytics.

In the case of an A/B test this is relatively easy. Tag your variances with the GA code snippet and perhaps give them a unique name. For a multivariate test this requires a little bit of technical knowledge; you have add a little bit of code to your test page. You’ll find the instructions here.

  1. Make a filter to exclude your test data from your other profiles
  2. Create an extra profile where you only measure your test pages
  3. Create Advanced Segments and extra goals in your testing profile relevant to the test. This lets you evaluate the test outcome on different visitor segments.

Other Resources

Have another resource? Add a comment!


New feature for improved payment control and convenience

We're excited to announce Make a Payment, a new AdWords feature that offers more control and security over when and for how much postpay advertisers are charged. Make a Payment allows you to initiate a credit card payment for any amount you want, and when it's convenient for you. You can even overpay your balance to cover future advertising costs. You'll still be automatically billed according to your regular billing cycle, so you don't have to worry about missing payments.

When initiating a payment, you can choose to pay off your entire balance or just a portion of it, which is particularly useful if you'd like to divide your balance among several forms of payment. You can also make a payment for an amount larger than your balance if you'd like to prepay for a certain amount of advertising costs. For example, assume your campaign consistently reaches its daily budget of $2,000. Your billing threshold is $500, which means you're charged $500 four times a day. If you initiate a payment of $10,000, then your next five days of advertising costs are covered, and you won't have to incur multiple payments every day.

If you're interested in trying Make a Payment, please complete this form. You'll receive an email confirmation once the feature is available in your account. You'll then be able to initiate a payment by visiting your Billing Summary page and clicking the "Make a payment" link beneath your account balance.

Please note that the feature currently isn't available for advertisers with billing addresses in Ireland. We appreciate your patience as we work to include these advertisers.

For more information about Make a Payment, please visit our Help Center or watch a video overview.

Monday, March 23, 2009

New Insights for Search features

Since we launched Google Insights for Search in August of last year, we've received great feedback about the many ways advertisers have been using Insights for Search - from anticipating demand better, to stocking desired brands, to finding new keywords for their AdWords campaigns from the list of top rising search terms. Today, we're launching additional features that will provide more granular data so you can make better informed advertising decisions.
  • New data sources - We've added additional data from Google News, Image and Product Search sites so you can see what the world is searching for beyond Google Web Search. For example, retailers could use the Product Search filter to get a better understanding of what people are more likely to buy, and then stock the appropriate products.
  • Category suggestions - Ever wonder what other categories your search terms might be classified under? Insights for Search now suggests category breakdowns for your terms. For example, if you type in the search term "apple", Insights for Search will show you all the relevant categories searches are classified under such as Computers & Electronics, Entertainment, and Food & Drink.
  • Metros for the U.S. - You can now drill down to specific geographic regions, or metros, to see how search interest levels vary. This can help you with geo-targeting in your AdWords campaigns.
For some quick inspiration on how to get started, check out our latest Google Insights for Search in 60 Seconds videos. You can also follow your favorite search terms from your iGoogle page by adding the Official Google Insights for Search Gadget.

Back to Basics: Is your website a "closer"?

Many successful sales people describe closing a sale as a process that is composed of many steps. It's a dialogue -- a series of information exchanges that culminates in the ultimate sale or final agreement. This closing process occurs thousands of times every day on websites around the world. Websites and visitors engage in a dialogue during which products are chosen, shipping and credit card information is provided, and sales are closed.

But a sales person has an advantage -- he or she can observe where customers get concerned or uncomfortable during a sales process and address these obstacles before they result in a lost sale. Your website can't do this by itself.

It's up to you, the website owner or manager, to look at what happens during each step of the closing process (i.e. conversion funnel) and find a way to make each page in the process as helpful and painless as possible.

You can look at the Funnel Visualization report in Google Analytics to see how many of your prospects move from one step to the next, where they drop out of the conversion process and where they go instead. Once you have this information, you can start fixing the pages that lose would-be customers, just as a good sales person addresses obstacles that prevent customers from closing.

You can learn how to use the Funnel Visualization report in the latest Google Analytics in 60 seconds video. Leave us a comment and let us know what you think.


Sunday, March 22, 2009

What's It Like To Be Our Customer?

What our customers are thinking, and what we think is on their minds are often times two different things. For your small business customers, before you have a meeting or pick up the phone, you should always review the following questions that may either uncover an opportunity or bring to light a festering issue before it becomes a major problem for the customer.

Think of your customers and ask yourself the following questions:
  • Is it easy to do business with us? - Perhaps the process of opening new accounts, etc. was created in a vacuum and is onerous for customers providing an unnecessary pain point.
  • How do they perceive our customer service? - Your sales and marketing departments may be doing a great job but other areas of the bank may be creating customer service issues. Most customers won't say anything until they're ready to hit the road.
  • Are we taking care of their business and personal needs? - Do you have too many single-service customers? If you never ask a business customer about their personal needs they will only think two things--you aren't interested or you just don't care.
  • Are we suggesting better or more innovative ways to meet their present and future needs? - Is your bank truly a trusted advisor to your business customers? That's only possible if you demonstrate a willingness to help the customer to achieve their long-term goals through advisory services. It's sometimes about sacrificing short-term sales goals. The more the customer grows their business the more opportunity the bank will have to develop deeper, more profitable relationships.
  • Are we asking the right questions to uncover their concerns? - Effectively profiling business customers to gauge their long-term strategies enables the bank, and the banker, to provide valuable strategic financial advice to become a true partner in the success of the business owner.
  • If concern areas are outside your scope responsibility, am I alerting the appropriate people so the problem can be addressed and corrected? - Too many times bankers fail to act on customer cues because "it is someone else's responsibility." This is one of the leading causes of customer attrition. It's the banker's responsibility to uncover concern areas, notify responsible parties, act as the conduit for problem resolution and then close the loop back to the customer.
  • Are we employing all of the bank's resources for the benefit of the customer? - Has the business customer been introduced to the cash management expert or wealth management professional at the bank to advise on various business and personal issues?
It's human nature that we tend to think that customers will automatically offer their thoughts to us just because we are sitting across the desk from each other. The lesson here is that if you don't ask the right questions you'll never get the answers necessary to advance a relationship or to stop a valuable customer from leaving.

From now on, before you visit or call a customer, ask yourself these questions and see if you can effectively answer them without the input of your customers. You may find that your conversations with your customers will take on a whole different perspective.

Thursday, March 19, 2009

Google Analytics at SES NY

SES New York is next week and Google Analytics will be there. You can come by the booth to meet members of the team and learn more about the latest features.

Here are a couple of sessions that you might enjoy:

Pay Per Conversation
Tuesday, March 24th, 1:45pm to 2:45pm
Sandra Cheng, Product Manager for Google Website Optimizer, and Bryan Eisenberg, will discuss a different approach to looking at your website's visitors. Every click is a potential customer trying to engage you; will you continue the dialogue or have them bounce off your landing page just moments after they arrive? This session will show you how to identify missed conversations and what you can do to improve them and your PPC ROI.
More info

Google Workshop: Maximizing Your Website's ROI
Wednesday, March 25th, 4:00pm to 5:15pm
Alex Torres, Product Marketing Manager for Google Enterprise, will talk about some of the many tools Google offers site owners can use to improve their website's return on investment. He'll also be giving a more in-depth look at Google Site Search.

If you also use AdWords, there's one more session you may want to attend: Preview the new AdWords interface, on Wednesday, March 25th from 10:45am to 12pm. They're taking questions in advance, so please send them in. Enjoy.

Meet the AdWords team at SES New York

If you're planning on attending Search Engine Strategies in New York next week, we hope that you'll come see us. Members of the AdWords team and other Googlers will be speaking at a handful of sessions, so please stop by and say hi.

Here are a few sessions that we think you'd enjoy:

Preview the new AdWords interface
Wednesday, March 25th, 10:45am to 12pm
You may have read that we're testing a new AdWords interface. In this session we'll be doing an in-depth preview of the new interface. If you have questions or feedback about the new interface, please send them to us ahead of time.
Speaking: Ariel Bardin and Angela Lai, AdWords product and engineering leads

Pay Per Conversation
Tuesday, March 24th, 1:45pm to 2:45pm
Many marketers agree that the current state of the economy is having an impact on their marketing plans. That's why every dollar and click matters. Every click is a potential customer trying to engage you; will you continue the dialogue or have them bounce off your landing page just moments after they arrive? This session will show you how to identify missed conversations and what you can do to improve them and your PPC ROI.
Speaking: Sandra Cheng, Product Manager for Google Website Optimizer

The State of Search - A Maturing Marketplace or Poised for More Growth?
Wednesday, March 25th, 1pm to 2pm
As ROI and performance become increasingly important, will search gain a larger share of advertising revenues? This panel takes a hard look at the current value proposition of search and what the future holds for the North American search marketplace.
Speaking: Jon Diorio, Group Product Manager, AdWords & Monetization Products

Advanced Keyword Research
Thursday, March 26th, 10:30am to 11:45am
How many keywords do you need in your paid search account? What keywords are your customers searching for? How do customers find products after they reach your site? This advanced session will demonstrate how to target the right terms in your paid and organic search marketing, and you'll learn where these keywords should be used.
Speaking: Frederick Vallaeys, AdWords Evangelist, Google

Ads in a Quality Score World
Thursday, March 26th, 2:15pm to 3:30pm
More and more, ranking well in paid search listings is less and less about how much you pay and more about the "quality" of your ad campaign. But what goes into making up your quality score? In this panel, we'll take a closer look at quality factors and give tips on increasing the perceived relevancy of your campaigns.
Speaking: Frederick Vallaeys, AdWords Evangelist, Google

We're looking forward to spending some time in the Big Apple; hope to see you there.

Wednesday, March 18, 2009

New templates for coupon display ads, as used by Razorfish

We now have two new display ad templates available which allow you to easily create online coupons to run on sites across the Google content network. You can probably guess why coupon-based promotions might be especially effective these days, and display ads allow you to add in eye-catching ad copy, coupon codes, and customized color schemes that wouldn't be possible with simple text ads.

Razorfish, a top digital advertising agency, has begun to use templates for coupon-based promotions for a major national retailer in the U.S. Danny Huynh, Associate Search Director at Razorfish, has this to say about the tool: "We see the display ad builder as a great creative sandbox, allowing us to us to quickly test and iterate with new ad formats and capabilities that simple text ads can't offer. The coupon templates in particular are allowing us to bring the messages from our customers' offline circulars, to the online world, at scale with Google's content network. We're planning to test display ad builder templates on an ongoing basis."

Each of our new templates has a prominent slot for featuring a price or a discount, e.g., "20% off," and has extra room for coupon codes. As with any of our other templates, you can easily edit your ads on an ongoing basis to change the discount level, prices and any other customizable aspect. Just remember that any edits will need to reviewed by an AdWords specialist, and may take 2-4 business days to take effect. Here's an example of the new templates, which come in several sizes:


To access these new templates, log in to your AdWords account and choose the "Display ad builder" ad format option within any ad group. Then, choose the "Retail" category to find the coupon templates. This video can also show you how to access the feature.

Introducing Hourly Tracking and more for your TV Campaigns

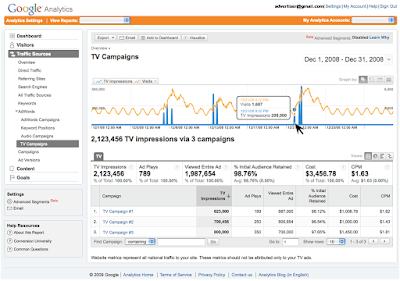
Imagine you're advertising on national television. You've selected several programs and networks that you think will deliver your message to the right audience. Now, wouldn't you want to know which of those target placements was most effective at driving traffic to your website? Well now it's even easier for Google Analytics and Google TV Ads advertisers to learn just that.

Check out the new hourly breakdown of your TV Campaigns metrics
alongside your website metrics. In addition, we've included two new TV campaign metrics, Viewed Entire Ad and % Initial Audience Retained, so you can see how viewer engagement relates to your website activity.


Here's more information on each of these enhancements:

New TV Ads metrics

The two new TV Ads metrics help you to understand full ad viewership with Viewed Entire Ads providing you an absolute number and % Initial Audience Retained providing this data expressed as a percentage.
  • Viewed Entire Ad: The number of impressions tuned to your ad from beginning through to the end.
  • % Initial Audience Retained: The proportion of the audience that was present at the beginning of the ad who then watched the entire airing to the end.
These two metrics are currently available in Report Center within AdWords, and we've now added them to the TV Campaigns report in Analytics. As always, Analytics provides powerful visualization tools. You can see TV campaign metrics alongside your website metrics to help you more easily identify which of your TV ad airings most effectively drove traffic to your website.

Hourly data reporting

One of TV advertisers' most requested features has been to view ad performance at an hourly level. Advertisers have been able to review TV campaign data at a daily, weekly and monthly level within Analytics. Today we've enhanced the TV Campaigns report to show metrics in hourly breakdowns. Simply click on the "Graph by Hourly" clock icon in the top right hand corner above the chart. This view makes it easier to attribute website metrics to specific TV ad airings.

Please note that the hourly display in Analytics is based on the specific time zone associated with your Analytics profile and AdWords account, while the TV Reports within AdWords will show the time of an ad airing based on the TV station's time zone. For example, if you live in San Francisco and have your AdWords account in the PST time zone but are airing an ad on the TV station's time zone of the East coast, the hourly data in your TV Campaigns report will be displayed based on PST.


With these enhancements to Analytics' cross-media reporting you can more easily analyze the online impact of your TV campaigns, and use this information to optimize your campaigns as you learn. If you're not currently advertising on TV and are interested in learning more, visit our Google TV Ads website.

Posted by Dai Pham, Google Analytics Team

Nothing Kills a Bad Product Faster Than Good Advertising

"Nothing kills a bad product faster than good advertising."
~ David Ogilvy

Even if you are the entire Marketing Department ... you're not an "Army of one."  

As a Marketing VP, I used to tell my sales staff, "I don't complete your annual evaluations, but you're in MY department."

As marketers, we need to step outside of the organizational chart and take responsibility for staff training ... after all, your sales staff must deliver on the promises that YOU make!

Provide The Right Tools
After completing hundreds of branch shops for clients all around the country, I've learned that the vast majority of financial institution "sales" is literally reading a brochure to the prospect.  Take a good look at the tools that you give your staff to use.
  • Are they easy to understand?
  • Are they focused on customer benefits?
  • Do they speak to customer needs?
  • Do they differentiate your institution and your product offerings?
  • Do they package the products in ways that will help your staff cross-sell?
Set Service Standards
Customer service is objective.  What one person sees as great customer service, another person may see as average.

Unless we create a set of clear, measurable Service Standards we cannot expect our staff to automatically know how to act.  

The goal is to have the service be the same from branch to branch and from market to market.
  • Put the standards in writing and come up with fun and creative ways to display them
  • Keep the list short - no more than 10 standards.  Only include the most important aspects of your institution's service
  • Do not focus on operational issues.  These are short service standards ... NOT an employee handbook or training manual. 
Make It Fun
Periodic internal sales promotions can work wonders.  Make a game of it.  Creating competition between your branches can help to build a team feeling within each branch.
  • Create a traveling trophy that the winning branch can display until the next internal promotion
  • Make sure that you focus on bundling products for extra points
  • Offer meaningful prizes to standout branches and individuals

We'd love to hear tips on how you train your sales staff, provide the right tools and make it fun! Please reply to this blog and brag about your efforts.

Take care,
Eric

Tuesday, March 17, 2009

Tips for Tracking Email Marketing Campaigns

Email campaigns are a cost-effective way of attracting quality return visitors to your site. It's important that you tag your email campaigns with campaign tags so that you can track how well each email performs. This lets you optimize your efforts and track your return on investment.

What are campaign tags?

Campaign tags are additional information that you apply to links. Once a link is clicked, the tag information is passed to Google Analytics. Tagged links allow you to evaluate the performance of individual links within your emails.

Why tag email links?

Let's say that you send out an email newsletter in January and February that does not use campaign tags. Visitors coming from emails reported within the Referring Sites Report will only include visitors coming from web-based email clients like Gmail:


But, did they visit your website as a result of the January email or the February email? Unless you've used campaign tags, you'll have no way of knowing.

Visitors who click a link in your email using an email client on their computer will be reported as Direct Traffic -- and will therefore be grouped in with visitors who used bookmarks or who typed your website's URL into their browser.


A quick reference for tagging emails

The Google Analytics URL Builder is a great tool for generating tagged links to use within your email campaigns.

You can pass the following information to Google Analytics in the form of campaign tagged links:

Name Description Examples
Campaign Name Name of the email marketing campaign. Email News,
Email Promo 14 April 2009,
Email Newsletter May 2009
Campaign Source Use Campaign Source to identify who distributed your email newsletter. If you are sending your own email campaign then use your own company name. If you advertise in other email newsletters then use the name of the particular company sending that newsletter.
Campaign Medium Set Campaign Medium as 'email' for all your email marketing campaigns. email
Campaign Content (optional) If you have multiple calls to action within your email, use different Campaign Content tags to see which version drives more visitors. 20% Discount Offer,
New Product Information,
Support Services
Product Image,
Read More Button,
Text Link
Campaign Term (do not use) Recommended for use in tracking Keywords in search marketing campaigns.


Make sure that you are consistent with the names that you use in your tags. For example, if you enter the source as Company_Name, company-name and Company+Name for three different emails, Google Analytics will report these as three unique sources.

Important Tip: Remember to generate new campaign tagged links for each campaign you send, otherwise you will not be able to compare your individual campaigns over time.

Making Life Easier

Don't have time to manually create campaign tagged links? There are several online email marketing solutions that automatically apply Google Analytics campaign tags to the links included within your emails.


These four solutions can automatically apply campaign tags to links in emails.

Campaign Monitor allows you to define which links should automatically have campaign tags applied (specified by domains) and allows you to assign the Campaign Source on the settings page.


MailChimp allows you to enter the Campaign Name when you create a new email campaign.


Be sure to research the limitations of each tool before launching your campaign. Campaign Monitor and MailChimp do not automatically differentiate unique links within an email. You may still want to manually tag each link within your campaign if that data is important to your organization.

That's all! Happy tracking.


Updated on 11/10/2011 -  with clarification for use of "Campaign Term".

A display ad builder contest reminder

Happy St. Patrick's Day. We recently announced a contest for the AdWords display ad builder. We've received some great entries, and with the deadline of March 24th coming up soon, we wanted to remind you to enter. Just fill out the form with your basic account and contact information, and we'll evaluate entries and choose winners based on creativity and innovative uses of the tool. For example, let us know if you've used the tool to create a great St. Patty's Day ad using our holiday template, or if you've used it to provide coupons to your customers to get them to visit your site. The top five entries win up to $1000 in AdWords credits, so get your entry in soon. This contest is only open to anyone in the U.S. with an AdWords account.

Monday, March 16, 2009

Back to Basics: Quick tracking code fixes

While browsing through some of the entries in the Google Analytics Help Forum, I found a useful thread on how to troubleshoot tracking code errors. Borrowing heavily from the conversations in the thread, I've summarrized the top ways to fix your tracking code here on the blog. Hopefully, after reading this post, you'll never have to return to work after the weekend to find that you have no data in your Analytics account! 

·  Make sure you have your Google Analytics Tracking Code installed on your site by checking your site's page source. I know, it seems obvious -- but it's actually one of the most common implementation errors our users encounter.

·  Remember to enter the code somewhere between the <body> and </body> tags, preferably towards the </body> tag.

·  Get rid of unnecessary line breaks in your code. Copy the tracking code exactly as it's generated from within your 'Instructions for adding tracking' page. For example,

         document.write(unescape("%3Cscript src='" + gaJsHost + "google-analytics.com/ga.js

 type='text/javascript'%3E%3C/script%3E"));


should be: 

document.write(unescape("%3Cscript src='" + gaJsHost + "google-analytics.com/ga.js' type='text/javascript'%3E%3C/script%3E"));

·  Having more than one Include filter in a profile may cancel out data collection for that profile. Try removing extra Include filters so that you've only assigned a maximum of one to your profile.

·  Try adding the "{}" after the "catch(err)" in your code. Although modifying the tracking code with this new addition is optional, doing so adds the benefit of removing a JavaScript error message for visitors who unintentionally have JavaScript messaging enabled on their browsers. For those visitors who have enabled messaging, the try and catch will have the effect of halting any messages from the Google Analytics tracking code snippet.

An example of the try and catch block is below: 

<script type="text/javascript">
  var gaJsHost = (("https:" == document.location.protocol) ? "https://ssl."  : "http://www.");
document.write(unescape("%3Cscript src='" + gaJsHost + "google-analytics.com/ga.js'  type='text/javascript'%3E%3C/script%3E"));

  </script>

  <script type="text/javascript">
  try {
  var pageTracker = _gat._getTracker("UA-50020-1");
  pageTracker._trackPageview();
  } catch(err) {}</script>

If you don't believe in the wisdom of crowds, hang out in our Google Analytics Help Forum and you may change your mind. Try asking a question on it or browse through other posts answered by our community of savvy Analytics users (we love you guys!).

Conversion Optimizer increases conversions and decreases CPA

We've just completed a new analysis on the performance of campaigns which have adopted Conversion Optimizer. We found that on average, these campaigns achieved a 21% increase in conversions while at the same time decreasing their CPA by 14%.

The analysis compares the performance of Conversion Optimizer campaigns with a control set of campaigns and represents the average impact of Conversion Optimizer. The actual impact will vary from campaign to campaign (and a small number of advertisers could conceivably perform better without Conversion Optimizer).

If you would like to learn more about Conversion Optimizer, the results we've seen, and how it can help you get more conversions and lower CPA, join us for one of the three webinars we are hosting March 18-19th. 

Posted by Amanda Kelly, Inside AdWords crew

Friday, March 13, 2009

New Podcast "Get Your Google Analytics On"

Check out this new podcast from Startup Nation. This week's episode gives a great beginner overview on how to get the most out of Google Analytics. It starts by explaining how to get up and running, and then explains how Startup Nation has used analytics to improve the performance of their own site. If you'd like to check out the contents before listening, you can also find an overview here.

Thanks to Brian Cleveland from Statup Nation for sharing his expertise. Happy Friday!

Don't Throw $$$ Down the 18th Hole!

Golf hole sponsorship -- $250

Spring Soccer League Sponsorship -- $400

Getting quantifiable ROI from any of these sponsorships – Doubtful


Stop right there! I urge you not to process that pile of sponsorship requests until you stop and answer some direct questions about why you are doing them and what you expect to get in return.

Yes, every company must support its local communities through charitable donations. However, sponsorships, as opposed to donations, mean you should get something back in return -- and a 5 inch one-color logo on a t-shirt just isn’t enough.

Take the time to look at all of your sponsorships with an objective eye and see if there aren’t better ways for you to build in a return on investment (ROI).

I used to do PR for McDonald’s and I can’t tell you how many sponsorship proposals came across my desk promising to give me logo exposure on banners and t-shirts. Well, there is a McDonald’s restaurant with huge golden arches every 4 miles or so in this country. We really weren’t looking for more logo exposure.

So, I rewrote the proposals and built in exposure that brought strategic value to McDonald’s. I used sponsorship of a community walk to promote a new line of salads and healthy kids meal options. I used sponsorship of a museum exhibit to showcase McDonald’s grants and activities in local elementary schools. Basically, I got strategic and creative and it paid off.

I urge you to look beyond logo exposure and build business drivers into your sponsorships.

  • Can you showcase cash management products like desktop deposit scanners to all of the small business owners at the golf outing?
  • When you sponsor the Spring Soccer League can you provide a bounce-back coupon for a free soccer photo frame to everyone who opens a child’s savings account?

Here are some questions that might help you be more strategic about your next sponsorship request:

1. What audience do I have access to with this sponsorship? Why is this audience important?

2. What do we MOST want this audience to know about us and what makes us different?

3. What business driver can I build into this sponsorship that will allow us to have another opportunity to touch this audience?

  • “We have innovative business products that save time for small business owners” – have a business banker on hand to showcase your business products
  • “We have online technology that saves Mom’s time paying the bills” – giveaway item that drives traffic to your online bill pay demo

4. How can I measure response to this sponsorship?

5. What plan can I put into place for my salespeople to follow up on these leads?


The bottom line – if you are creative you can do something good for the community and something good for your business at the same time. Make sure you take the time to make your sponsorships a win-win situation.

Post a comment and share great sponsorship ideas you’ve seen or implemented.

Deanna

Thursday, March 12, 2009

AdWords system maintenance on March 14th

On Saturday, March 14th, 2009, the AdWords system will be unavailable from approximately 10 a.m. to 2 p.m. PST due to system maintenance. While you won't be able to sign in to your accounts during this time, your campaigns will continue to run as usual. We apologize for any inconvenience.

Motion Chart Scavenger Hunt Followup

Last week we launched some new features in Motion Charts. Instead of telling you what they were, we decided to let you discover them for yourself and post what you found in our blog comments.

It didn't take long for several of you to find the new features. Karthik was first to notice that you can now control bubble opacity and that you can zoom into the chart. This is a great feature that allows you to eliminate the distraction of outliers and focus on the core data set. Nick and Adrian P. also found the zooming and panning feature and the bar charts, but a special Congratulations is in order to Rajeev Edmonds who found (almost) all of the new features.

One feature hinted at in Rajeev's comment bears a little more explanation. It's now easier to find specific data points because there's a Select list which has all the data points listed in alphabetical order. So, instead of mousing over the dots or barchart, you can just select them in the Select list. And then, when you don't need the labels anymore, you deselect all the data points by clicking "Deselect all."

A couple of not-so-new features were also identified. Lin/Log scale and the ability to bookmark charts have been there all along -- but we're happy that you've noticed them again :)

As far as the Advanced State string, this little feature was built to support hard-core flash developers who work with the Motion Charts tool, but was not actually intended to make it into Google Analytics. In other words, it's a (harmless) bug, so thanks to everyone for noticing it!

So what do you think about the scavenger hunt idea? We've never heard of anyone else launching features this way and we thought it was a bit unique -- did you like it? Are you clear on what the features are now? Do you use Motion Charts? Leave us a comment and let us know.

Introduction to the ad auction

When we go to conferences or read posts in forums, we find that advertisers sometimes know more about advanced features than about the basics of how AdWords works. So, we've decided to take some time to get back to basics and talk about how the AdWords auction actually works. To help you, we've brought along our Chief Economist, Hal Varian, to walk you through the auction and explain how your maximum cost-per-click (CPC) bid and Quality Score determine how much you actually pay for an ad click on Google's search results pages.

When people think of an auction, they often think of a prize being sold for the highest bid. But the AdWords auction works a little differently, where the winner only pays the minimum amount necessary to maintain their position on the page. That means you'll only pay the minimum necessary to beat the person below you. In fact, our quality-based pricing system ensures that you'll often pay less than your maximum bid.

How exactly does this work? We'll leave that to Hal to explain.


If you have trouble viewing this video, you can watch it here.

Wednesday, March 11, 2009

Sitcoms

About an hour ago I could hear my husband laughing hysterically...he was flipping channels as he waited for his latest coding change to upload (he's a software developer!) and came across a classic Cheers episode. You know the one...it's the episode where the writers ran out ideas but wanted to have a "new" show so they put together the highlight reel. SNL is making a killing doing the same thing right now! So here' my attempt to refresh your memory on some MarketMatch classics:

So, Soap is smarter than a bank? The blog was posted June 18, 2008. That day, the Dow closed at 12,029.06 and Barack Obama was still "just" a senator. So is this blog post still relevant today? ABSOLUTELY!! Now, if never before, is your opportunity to differentiate yourselves from everyone else in your market. What do you stand for? Are your institution's value statements posted on a wall in the breakroom? Do you even have value statements? You need to be reinforcing them with your staff, your customers and your community at large! Carpe diem!

On Monday, October 20, 2008 one of my fellow MarketMatch bloggers, Nick Vaglio posted ALCO is Not Dog Food. With the media abuzz in the banking industry, I think this post deserves an encore! As you communicate your safety and soundness, respond to media questions and use publicity to promote your institution, please reference back to this. I have read more press releases and advertisements referencing LTV, various ratios and other banking-specific acronyms to choke a horse. This is more important than ever right now!

And on a final note for this fine Wednesday afternoon, Eric Gagliano posted Who is Your Uncle Dave on December 22, 2008. Eric, thank you. Thank you for reminding us that people do business with people. We all know customers are more likely to do business with those we respect, appreciate and care for. Does your community care about you?

And as Bruce would say, Cheers!

Jenna

New ways to reach the right audience on the Google content network

Reaching the right audience is the goal of every ad campaign. This week we're announcing new capabilities planned for the Google content network that will help you achieve that goal. In addition to matching ads with the topic of a web page through contextual advertising, you will be able to reach users based on their interests, independent of the content they are currently reading.

Over the next few months we'll start offering interest-based advertising to a limited number of advertisers as part of a beta, and expand the offering later in 2009. If you would like to participate in the beta, please fill out this form.

With interest-based advertising, you will be able to reach users based on your past interactions with them, such as their visits to your website. We'll also provide interest categories, such as "sports enthusiasts," so you can reach the audience of your choice. Whether your goal is to drive brand awareness or increase responses to your ads, these capabilities can help expand the success of your campaigns.

Users browsing the web will benefit from the additional relevancy that interest-based ads can provide. And by visiting the new Ads Preferences Manager, users can see what interest categories we think they fall into, or add and remove categories themselves. The Ads Preferences Manager can be found by clicking on most "Ads by Google" links you see on ads throughout the web.

You can read more about how interest-based advertising benefits the online ecosystem and about the new privacy tools developed for this launch in the Official Google Blog and the Google Public Policy Blog. To learn more about the details of interest-based advertising, please visit this page.

We look forward to providing users with ads more closely tied to their interests and helping you to better reach your campaign goals at scale.

- Aitan Weinberg, Product Manager