Over the last few months, we’ve hosted a number of Learn with Google webinars that help you go bigger, faster with AdWords technology that does the heavy lifting so that you can increase efficiency and reach new customers. In March we walked through best practices for efficiently building, optimizing and managing large campaigns using AdWords Editor and Automated Rules. Then in July we shared an overview of four account management tools -- AdWords Editor, automated rules, AdWords scripts and DoubleClick Search -- to help you navigate your choices and make the best decision for your business.
After each of these webinars, you shared that you’d like a deeper dive on how to make the most of these tools, including a walkthrough of new and little known features, as well as advanced applications. We heard you loud and clear, and are pleased to bring you two webinars focused on in-depth best practices for using AdWords Editor and AdWords scripts to manage your accounts automatically and at scale.
Managing AdWords Accounts at Scale - Go Bigger, Faster with AdWords Editor
Wed, Sept 5, 10am PDT / 1pm EDT (TODAY!)
This webinar is intended for current AdWords Editor users who are looking for a product refresher, as well as tips for making the most of new features released in version 9.8.1.
Managing AdWords Accounts at Scale - Go Bigger, Faster with AdWords Scripts
Thurs, Sept 13, 10am PDT / 1pm EDT
This webinar will be on AdWords scripts, a new tool which allows you to make changes to an AdWords account by writing simple JavaScript programs. We'll provide an overview of what can be accomplished with scripts, walk through ways to customize pre-set scripts, and show you how to write scripts from scratch. It is intended for AdWords users who have some basic programming experience and are excited to take advantage of this new tool.
Register for these, and other Learn with Google webinars, here.
Wednesday, September 5, 2012

Language Preference of Hispanics and Perceptions of Financial Well Being: Implications for Marketing
To what extent has the financial situation affected the perceptions of financial well-being of Latinos depending on their language preference? This question has implications because the answer may impact the way in which consumers make purchase decisions.
Language preference among Hispanics has been considered a proxy for acculturation. It is also an indicator of the many aspects of life that impact Hispanics from media preferences to interpersonal interactions. The anti-immigration sentiment prevalent in many circles in the US these days has hurt recent immigrants in particular. In addition, economic circumstances in the past few years are likely to have affected Latinos differentially depending on their integration in the US.
Using data from the Simmons National Hispanic Consumer Study that was collected in the twelve months ended on March 16, 2012, I created crosstabulations of language preference by financial outlook among Hispanics. Language preference was gauged as the language the respondent prefers to speak in general and the response categories were Only English, Mostly English but Some Spanish, Mostly Spanish but Some English, and Only Spanish. For this analysis I collapsed Only and Mostly English and Only and Mostly Spanish to form the preferences for English or Spanish.
The financial outlook dimension was measured with the question: Do you think you are better off or worse off financially now than you were 12 months ago? The response categories were Significantly Worse Off, Somewhat Worse Off, About the Same, Somewhat Better Off, and Significantly Better Off. For the purposes of this analysis I collapsed those who answered significantly and somewhat worse off, and those who answered significantly and somewhat better off to result in three categories: Better Off, About the Same, and Worse Off.
The resulting “average” table is presented below:
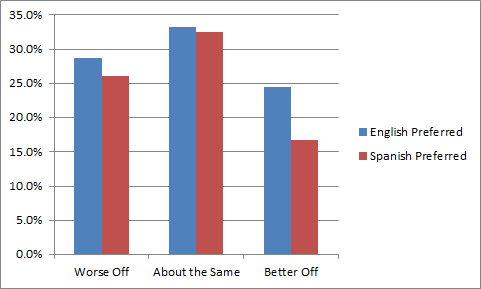
The plurality, over 30% of Latinos indicate that their financial situation is about the same as it was 12 months ago. This can mean different things. It can mean that things have not improved or that things have been as good as they were a year ago. Given the economic situation the US is going through, most likely it means that things have not improved but not gotten worse. Also, the “fatalism” prevalent in the culture may lead many to express that things are the same as usual and that in the average there is no change.
English preferred Hispanics, however, have a much more positive perspective than Spanish preferred Latinos as a substantively larger percentage of them indicate they are better off now than 12 months ago than their Spanish preferred counterparts. This may not be completely surprising since Spanish preferred respondents are more likely to be more recent immigrants and also more likely to suffer the consequences of immigration policies. These more recent immigrants are also more likely to have suffered from lack of work due to the lack of jobs in industries like construction that have traditionally employed many recent immigrants from Mexico and other parts of Latin America.
In a somewhat contradictory fashion, a few more English preferred Hispanics also report being worse off now than Spanish preferred respondents, but the differences between these two groups are very small. What is interesting is that over 25% of Latinos feel things have been worse for them in general. While not surprising, these figures bring home the notion that the economy and immigration related issues are likely to have made life worse for many Hispanics who try hard to make a living for themselves and their families.
The news for marketers are mixed. The majority of Hispanics feel they are better off or about the same as they were 12 months ago, and that is good news as that means that spending by most Latinos is likely to continue at a sustained pace. The negative news are that a substantial percentage feel the brunt of pervasive immigration and economic conditions and that their spending may be limited by their actual and perceived spending power. This brings about the importance of making politicians aware that the uncertainty of immigration reform needs to be removed for economic growth. The clarification of immigration policies and rules is likely to make the future more predictable and optimistic for many. Also, as in the overall economy, job creation should be a most important priority.
The data used here is from the Simmons National Hispanic Consumer Study and collected from January 31, 2011 to March 16, 2012. The sample contained 3,518 English preferred Latinos, and 2,104 Spanish preferred Hispanics.
Language preference among Hispanics has been considered a proxy for acculturation. It is also an indicator of the many aspects of life that impact Hispanics from media preferences to interpersonal interactions. The anti-immigration sentiment prevalent in many circles in the US these days has hurt recent immigrants in particular. In addition, economic circumstances in the past few years are likely to have affected Latinos differentially depending on their integration in the US.
Using data from the Simmons National Hispanic Consumer Study that was collected in the twelve months ended on March 16, 2012, I created crosstabulations of language preference by financial outlook among Hispanics. Language preference was gauged as the language the respondent prefers to speak in general and the response categories were Only English, Mostly English but Some Spanish, Mostly Spanish but Some English, and Only Spanish. For this analysis I collapsed Only and Mostly English and Only and Mostly Spanish to form the preferences for English or Spanish.
The financial outlook dimension was measured with the question: Do you think you are better off or worse off financially now than you were 12 months ago? The response categories were Significantly Worse Off, Somewhat Worse Off, About the Same, Somewhat Better Off, and Significantly Better Off. For the purposes of this analysis I collapsed those who answered significantly and somewhat worse off, and those who answered significantly and somewhat better off to result in three categories: Better Off, About the Same, and Worse Off.
The resulting “average” table is presented below:
The plurality, over 30% of Latinos indicate that their financial situation is about the same as it was 12 months ago. This can mean different things. It can mean that things have not improved or that things have been as good as they were a year ago. Given the economic situation the US is going through, most likely it means that things have not improved but not gotten worse. Also, the “fatalism” prevalent in the culture may lead many to express that things are the same as usual and that in the average there is no change.
English preferred Hispanics, however, have a much more positive perspective than Spanish preferred Latinos as a substantively larger percentage of them indicate they are better off now than 12 months ago than their Spanish preferred counterparts. This may not be completely surprising since Spanish preferred respondents are more likely to be more recent immigrants and also more likely to suffer the consequences of immigration policies. These more recent immigrants are also more likely to have suffered from lack of work due to the lack of jobs in industries like construction that have traditionally employed many recent immigrants from Mexico and other parts of Latin America.
In a somewhat contradictory fashion, a few more English preferred Hispanics also report being worse off now than Spanish preferred respondents, but the differences between these two groups are very small. What is interesting is that over 25% of Latinos feel things have been worse for them in general. While not surprising, these figures bring home the notion that the economy and immigration related issues are likely to have made life worse for many Hispanics who try hard to make a living for themselves and their families.
The news for marketers are mixed. The majority of Hispanics feel they are better off or about the same as they were 12 months ago, and that is good news as that means that spending by most Latinos is likely to continue at a sustained pace. The negative news are that a substantial percentage feel the brunt of pervasive immigration and economic conditions and that their spending may be limited by their actual and perceived spending power. This brings about the importance of making politicians aware that the uncertainty of immigration reform needs to be removed for economic growth. The clarification of immigration policies and rules is likely to make the future more predictable and optimistic for many. Also, as in the overall economy, job creation should be a most important priority.
The data used here is from the Simmons National Hispanic Consumer Study and collected from January 31, 2011 to March 16, 2012. The sample contained 3,518 English preferred Latinos, and 2,104 Spanish preferred Hispanics.
Twtvite Updated – Sleek New Features
Twtvite has gone through a major update since I used it last. In fact, I’m so impressed that I wanted to share with you here. “Twtvite” (pronounced Twit-vite) allows you to easily create and share tweetups with your followers on Twitter (and beyond). You can create a tweetup on the fly or plan one well in advance. If you haven't planned a tweetup before, you may want to read this post first.
Laura is a marketing professional and blogger who has been active in social media since 2005. If you enjoyed this post, please consider subscribing to this blog via Email or RSS. Laura can also be found on Twitter (@LauraCatherineO), Facebook, and LinkedIn.
In the past, you could add a logo and small banner to your Twtvite event invitations, but the rest of the invite was pretty generic. I’m sharing a screenshot of the tweetup I just created on their upgraded site, plus details on the upgrades below. If you’re in Charleston, be sure to join us for the September Charleston Ladies Who Lunch tweetup on 9/14 (info).
Twtvite Features I love:
 |
| Click photo above for full-size look |
- Customizable background adds a sleek look – upload your own or use your twitter background. I matched the background below to the background from the Charleston Ladies Who Lunch website. Great for branding!
- Nice, wide header across the top – perfect for your logo or just about anything (measures 940 pixels wide by 100 pixels tall for those designing the graphics)
- Large event photo (600 pixels wide) space just below the header – Perhaps my favorite part! What a difference it makes…
- Event hashtag prominently placed in red (top right) – love it
- Easy RSVP options (plus feature to RSVP for others who may not be on Twitter)
- As always, great Google map, RSVP count and (perhaps new?) invite views
- This was there before, but I still love the event “wall” – a play on Facebook, but still nice!
Ready to create your own Twtvite? Just visit www.twtvite.com and login with Twitter. Then, follow the simple steps to create your event in minutes. (Tips on planning a Tweetup here). I use the free version and it has served me well.
Laura is a marketing professional and blogger who has been active in social media since 2005. If you enjoyed this post, please consider subscribing to this blog via Email or
RSS. Laura can also be found on Twitter (@LauraCatherineO), Facebook, and LinkedIn.Tuesday, September 4, 2012
Keepin’ it fresh with seller ratings extensions
Nearly two years ago we introduced seller rating extensions. In addition to helping users identify highly recommended advertisers, seller rating extensions often provide a CTR lift to sellers who consistently deliver a positive online experience.
Today, we’re announcing a change to help keep ratings fresh and relevant. Previously, we would show seller rating extensions only for advertisers that have at least 30 lifetime reviews and a 4-star average. Moving forward, we will only show seller rating extensions for advertisers that have at least 30 reviews over the last 12 months and a 4-star average.
Since customer opinions about a business can evolve over time, this change will help make seller rating extensions more useful and relevant for searchers. It should also benefit businesses that satisfy customers and garner positive reviews on an ongoing basis.
For more information about seller rating extensions, please visit the AdWords Help Center.
Today, we’re announcing a change to help keep ratings fresh and relevant. Previously, we would show seller rating extensions only for advertisers that have at least 30 lifetime reviews and a 4-star average. Moving forward, we will only show seller rating extensions for advertisers that have at least 30 reviews over the last 12 months and a 4-star average.
Since customer opinions about a business can evolve over time, this change will help make seller rating extensions more useful and relevant for searchers. It should also benefit businesses that satisfy customers and garner positive reviews on an ongoing basis.
For more information about seller rating extensions, please visit the AdWords Help Center.
Thursday, August 30, 2012
Do you have any social media pet peeves?

According to Wikipedia, “A pet peeve is a minor annoyance that an individual identifies as particularly annoying to a greater degree than others may find it.” You may get annoyed when driving and someone tailgates. Or you may get annoyed at the supermarket or a doctor’s office because people are using their cell phones and yelling. Or you may get annoyed when a telemarketer calls your house during dinner. These may be examples of your day-to-day pet peeves, but what about social media? Do you have any social media pet peeves?
As the social media landscape has grown, both in the number of networks and the number of users, it’s natural to develop some minor annoyances. Here’s a list of my “Top 10” social media pet peeves:
[1] LinkedIn: When someone sends an invitation to connect but doesn’t customize the invitation. Who wants to receive a generic “I’d like to add you to my network” message? What if you never met the person in person or online? Shouldn’t a reason for connection be provided, or at the very least, some reference to a mutual acquaintance?
[2] Facebook: It seems as if the designers want to re-design the site on a regular basis. Can’t they be satisfied with anything they design? Settings have to be reviewed, users have to become comfortable with the changes, and above all, users have to spend time (that most don’t have) to improve the presentation of their pages and/or content.
[3] All major sites: Once a site makes a significant upgrade or design change, other sites follow. Now, many sites have similar user interfaces. What happened to unique design elements? Doesn’t any site want to look unique anymore?
[4] Twitter: When users send automatic direct messages (DMs). This goes against the entire concept of being social and participating in conversations.
[5] Twitter: #Highlighting #every #word in a #sentence with a #hashtag. The concept of a hashtag is to focus attention on one or two words for search purposes and emphasis. The excessive use of hashtags accomplishes nothing.
[6] Twitter Retweets: When users retweet every tweet that features them. While everyone appreciates positive comments, constant self-promotion turns people off. Another annoyance is when users ask for their tweets to be retweeted. Naturally, we’d all like our tweets to appeal to everyone, but it’s annoying when a tweet ends with: “Please RT.”
[7] Foursquare: When users announce that they’re at the post office, the coffee shop, the gas station, etc. If you want to meet someone, use the phone, speak to them, and make plans. Don’t expect them to surprise you at the gas station just because they happen to be nearby.
[8] Facebook and Twitter: Lack of an avatar. When users have the Twitter default egg image or the Facebook default white head on blue background image, it’s clear that the person has no intention of participating in social media. He/she might be a member of Witness Protection, and then he/she shouldn’t participate in social media anyway.
[9] All networks: When users post the same content on Facebook, Google Plus, LinkedIn, and a shorter version on Twitter. The platforms are different. A person may be connected to different people on each network. Some may use Facebook for personal connections, LinkedIn for professional connections, and Google Plus for a variety separated by circles.
[10] All networks: Users who don’t understand the concept of engagement and focus on selling their products or services rather than on conversations.
Did your social media pet peeve make the list? If not, please chime in.
A final note: a big “thank you” to some amazing Social Media Masterminds (#socialMM on Twitter) for sharing their pet peeves. They can be found on my Twitter List here.
How One Online Food Retailer Increased E-commerce Sales By 70% In Key Regions
LaTienda is an award-winning, family-owned business supporting artisanal firms in Spain. The firm works with small family-run businesses, many of which are dedicated to centuries-old food-making traditions.
With warehouses in Williamsburg, Virginia and Alicante, Spain, the company ships hundreds of thousands of orders throughout the United States, Canada and Europe.

Overall, they had been seeing great success with their online orders, though they wanted to continue looking for opportunities to grow sales. To assist with this, they worked with WebStrategies, located nearby in Virginia.
They knew that a key product category in particular required more expensive shipping methods if it was too far from LaTienda’s Virginia warehouse. Their challenge was to understand the impact on sales of varying shipping rates for this subset of products.
With warehouses in Williamsburg, Virginia and Alicante, Spain, the company ships hundreds of thousands of orders throughout the United States, Canada and Europe.
Overall, they had been seeing great success with their online orders, though they wanted to continue looking for opportunities to grow sales. To assist with this, they worked with WebStrategies, located nearby in Virginia.
They knew that a key product category in particular required more expensive shipping methods if it was too far from LaTienda’s Virginia warehouse. Their challenge was to understand the impact on sales of varying shipping rates for this subset of products.
LaTienda grouped visitors into two regions: Region A visitors were close enough to the warehouse to always get reasonable shipping costs. Region B visitors were everywhere else, and had to use a more expensive shipping method for the key product category.
WebStrategies wanted to measure the impact on sales whenever one of the key products was placed in the cart. To measure this, they installed Event Tracking to the “Add To Cart” buttons on every product page.
They then used Advanced Segments Custom Reports to separate visitors in Region A from Region B, and drilled down to view performance by product category. Sure enough, visitors from Region B were found to be 48% less likely to purchase if they placed an item from the key product category in their cart, which raised total shipping costs.
To combat this effect, LaTienda.com implemented a less expensive, flat rate shipping model in region B and monitored sales. After the test, the rate at which Region B visitors completed the shopping cart were found to have increased by nearly 70%.
Just to be sure, they checked to see if there was a similar increase in conversion rate for Region A visitors, and found that it did not fluctuate more than 3.4% over the same time period. The analysis confirmed that product shipping rates greatly impacted shopping cart behavior, and used data to measure the results of a key business decision.
Check out the full case study as a PDF download, and see additional success stories in our analytics case studies and success stories section.
Posted by the Google Analytics Team
Posted by the Google Analytics Team
Wednesday, August 29, 2012
Multi-Channel Funnels: Webinar, Checklist, Tips & Tricks
Understanding the customer journey, from consideration to conversion, is no easy feat. But with tools like Multi-Channel Funnels (MCF) in Google Analytics, we’re working to make it easier to uncover new insights and opportunities to improve marketing performance. As Google’s Global Program Manager for Attribution, I recently led a webinar that highlighted opportunities to:
QUESTIONS
What do I need to use Multi-Channel Funnels properly?
MCF Implementation Checklist:
Is it possible to integrate the data from Multi-Channel Funnels directly into our own systems?
Absolutely. Not only are all of these data points available for export from the Google Analytics interface in commonly-used formats, we also just announced the release of the Multi-Channel Funnels API so that developers can tap directly into this incredibly powerful data source. See our recent blog post for more information.
How do we ensure we are tracking all our channels in a way that is optimal for these reports?
By default, all inbound clicks that are part of a conversion path are captured by Multi-Channel Funnels. The default channel groupings that we provide then make a series of fairly reasonable assumptions to group traffic into their respective buckets. As a user, you have two approaches to ensure that all traffic is ending up in the right place:
Does MCF have to be a true purchase or it will it work for a Business-to-business company looking for qualified leads?
Companies that are pursuing leads tend to have much shorter conversion paths than those that are tracking purchases. It's not entirely uncommon to see lower assist / last ratios and, equally, to have the perception of less opportunity when reviewing the MCF reports around a single goal. As a better practice, we suggest that advertisers implement multiple goals to measure customer activities along a wider path.
For instance, goals could be set up at points before filling out a lead form but after becoming a slightly more qualified customer, either by increasing time or page depth on your website, reviewing a whitepaper or looking at cost information. These would help to measure performance even if there is a more significant lag before becoming a lead, lending insight to the very early parts of the journey.
After the lead form is filled out, any unique action that you could encourage to bring the now qualified customer back to the site again, such as completing a signup process, reviewing a contract or qualifying for a promotional offer, can then be used to go all the way back through to the beginning of the journey to find that initial contact point.
Why is (not set) so high for AdWords Keyword?
When you select a primary dimension in the Assisted Conversions report of Multi-Channel Funnels, it is not filtering the information as much as it is adding a different view to it. As such, when I move from that basic channel grouping view to AdWords Keyword, the report still shows 100% of the data but now groups each interaction by its respective keyword. However, since not all interactions have AdWords Keyword data associated with them, including Direct, E-Mail and Social Network visits, they are grouped into their own (not set) bucket.
During the webinar, my colleague responded to this question by saying that “not set” may also appear due to broken AdWords tags. This response is also technically correct as broken AdWords tags can also prevent keyword information from being passed through, but in many cases it’s more likely that it’s just because the visits don’t have keyword data associated as described above, and AdWords tags are probably OK -- so consider this first before trying to troubleshoot.
What devices are in place to prevent Spiders and Bots from inflating data and thus causing a possible "bad" business decision?
Multi-Channel Funnels measure specific goal or conversion actions that are hopefully beyond the grasp of bots or spiders that are just mining content. For instance, it probably wouldn't be likely to find one that tries to fake e-commerce orders.
If you have found bots coming through these conversions on your website (i.e. Store Locator), it may be practical to filter those visits out at the profile level in Google Analytics to make sure that they are not impacting any of your resulting analyses. Although we don’t recommend a specific set of criteria for limiting bots, there are dozens of articles online that you should be able to find with individual opinions on what is best.
- Improve keyword coverage to reach customers at all stages of the conversion path.
- Identify those channels that directly contribute to the growth of your business.
- Learn how metrics like average order value can be influenced by early-stage marketing.
QUESTIONS
What do I need to use Multi-Channel Funnels properly?
MCF Implementation Checklist:
- Install Google Analytics! Make sure that all of your webpages are tagged, and if you happen to have more than one website (yoursite1.com and yoursite.2com) or multiple domains (red.mysite1.com and blue.mysite1.com) that you are set up to use Multi-Domain tracking. This last step will ensure that you are tracking all interactions across your sites into a single customer path.
- Set up E-Commerce Tracking or Goals. MCF needs to know what action represents the very end of the customer path - the conversion. The conversion may be a sale, or it could be another action that’s valuable for your business, like filling out a lead form or downloading a brochure. For businesses selling products online, you can measure conversions (sales) through e-commerce tracking. If you’re measuring visitors that take a specific action, such as completing a form, setting up goals will suffice.
- Get your tags in order. For AdWords customers, make sure that your advertising account is linked to your Google Analytics profile and that auto-tagging is enabled. For other channels, such as e-mail or advertising run on other networks, our custom URL builder will help you build the tags necessary for each campaign. If you’re new, be sure to learn more about channels and channel grouping.
- Start using the MCF reports. Once you’ve followed the steps above, you can find the Multi-Channel Funnels reports in the Standard Reporting tab of Google Analytics: click on “Conversions” at the left-hand side of the user interface, then click “Multi-Channel Funnels.”
Is it possible to integrate the data from Multi-Channel Funnels directly into our own systems?
Absolutely. Not only are all of these data points available for export from the Google Analytics interface in commonly-used formats, we also just announced the release of the Multi-Channel Funnels API so that developers can tap directly into this incredibly powerful data source. See our recent blog post for more information.
How do we ensure we are tracking all our channels in a way that is optimal for these reports?
By default, all inbound clicks that are part of a conversion path are captured by Multi-Channel Funnels. The default channel groupings that we provide then make a series of fairly reasonable assumptions to group traffic into their respective buckets. As a user, you have two approaches to ensure that all traffic is ending up in the right place:
- The first option is tag all of your marketing activities in a way that matches the logic of the default channel groupings. You can find the rules behind the groups in this help center article. There is also a simple URL builder so that you can append the proper tags to your other campaigns.
- The second option is to create channel groupings that match the way you are currently naming and tagging your campaigns. This approach tends to be favored by those companies that want to utilize all of their historical data in MCF right away, or have technical limitations preventing them from changing the actual campaign tags. Implementation details for this approach can be found on the Analytics Help section, in this article on channel groupings.
Does MCF have to be a true purchase or it will it work for a Business-to-business company looking for qualified leads?
Companies that are pursuing leads tend to have much shorter conversion paths than those that are tracking purchases. It's not entirely uncommon to see lower assist / last ratios and, equally, to have the perception of less opportunity when reviewing the MCF reports around a single goal. As a better practice, we suggest that advertisers implement multiple goals to measure customer activities along a wider path.
For instance, goals could be set up at points before filling out a lead form but after becoming a slightly more qualified customer, either by increasing time or page depth on your website, reviewing a whitepaper or looking at cost information. These would help to measure performance even if there is a more significant lag before becoming a lead, lending insight to the very early parts of the journey.
After the lead form is filled out, any unique action that you could encourage to bring the now qualified customer back to the site again, such as completing a signup process, reviewing a contract or qualifying for a promotional offer, can then be used to go all the way back through to the beginning of the journey to find that initial contact point.
Why is (not set) so high for AdWords Keyword?
When you select a primary dimension in the Assisted Conversions report of Multi-Channel Funnels, it is not filtering the information as much as it is adding a different view to it. As such, when I move from that basic channel grouping view to AdWords Keyword, the report still shows 100% of the data but now groups each interaction by its respective keyword. However, since not all interactions have AdWords Keyword data associated with them, including Direct, E-Mail and Social Network visits, they are grouped into their own (not set) bucket.
During the webinar, my colleague responded to this question by saying that “not set” may also appear due to broken AdWords tags. This response is also technically correct as broken AdWords tags can also prevent keyword information from being passed through, but in many cases it’s more likely that it’s just because the visits don’t have keyword data associated as described above, and AdWords tags are probably OK -- so consider this first before trying to troubleshoot.
What devices are in place to prevent Spiders and Bots from inflating data and thus causing a possible "bad" business decision?
Multi-Channel Funnels measure specific goal or conversion actions that are hopefully beyond the grasp of bots or spiders that are just mining content. For instance, it probably wouldn't be likely to find one that tries to fake e-commerce orders.
If you have found bots coming through these conversions on your website (i.e. Store Locator), it may be practical to filter those visits out at the profile level in Google Analytics to make sure that they are not impacting any of your resulting analyses. Although we don’t recommend a specific set of criteria for limiting bots, there are dozens of articles online that you should be able to find with individual opinions on what is best.
Subscribe to:
Posts (Atom)