
With evolving technologies and platforms, financial marketers need a clear and comprehensive set of metrics to determine the effectiveness of their online channel.
Instead of drowning in data and not being able to connect the dots in a meaningful way, here are four metrics that rise to the top and provide the clearest picture as to the selling power of a bank or credit union website.
By Melanie Friedrichs, Analyst for Andera, Inc.
In the Wild Wild West atmosphere of the early internet era, companies raced to slap websites online without thinking too hard about what purpose their website should ultimately serve. Consumer retail companies found their ROI in online shopping, and their websites gradually evolved to draw visitors in and drive them to checkout. In contrast, financial institutions focused on expanding eServices, until their websites became little more than portals to online banking.
In the last few years, we’ve seen institutions start to wise up to a second, essential function of the online channel. As Joe Swatek from ACTON Marketing said, “Your website has an important SALES function.” Technology has made it possible for financial institutions to acquire new customers and members and grow relationships completely digitally, and like consumer retail websites aim to sell consumer products, financial institution websites should aim to open new deposit accounts and originate loans. When thinking about the account opening and lending through the online channel, there are four essential metrics that financial institutions should consider:
1) Conversion Rate
The single most important metric for a financial institution website is its conversion rate, or the percentage of qualified unique visitors that begin applications for deposit or loan products.
Before the introduction of online account opening and lending, financial institutions focused primarily on making online banking login as easy as possible, and on providing key corporate information. The rest of the website really didn’t matter that much, so webmasters cluttered pages with news items and product advertisements from different departments. Over time, most financial institution websites began to resemble ill-managed community bulletin boards.

Unfortunately, bulletin boards don’t convert particularly well. For one, the paradox of choice applies: when there are hundreds of calls to action, and no one call to action is emphasized over the others, most site visitors won’t answer any call to action at all. This principle has been proved again and again in consumer retail. What’s more, most financial institutions do a surprisingly poor job of emphasizing product benefits, and many hide or leave out essential rate information. For more resources on website optimization for conversion see here, here and here.
Not surprisingly, online-only banks tend to have conversion-focus websites. Three great examples are Moven, GoBank, and Perkstreet Financial. All three have simple, almost spare websites that emphasize benefits and that drive visitors toward their application button.


Some institutions have ironically invested the time and money to optimize their website, but they don’t allow site visitors to sign up online, and direct them instead to a paper application, ask them to visit a branch, or ask them to phone into a call center. Certainly, some consumers like to compare rates and products on the internet but ultimately want to open their new accounts by talking to a human directly, but in today’s online-centric world, institutions that don’t let consumers complete the process online are leaving money on the table.
2) Abandonment Rate
The second most important metric that financial institutions should track is their abandonment rate, or the percentage of started applications that are never submitted because the applicant abandoned the process
Checkout abandonment is a much studied topic in consumer retail, and generally the experts agree on one thing: a shorter process is better. Amazon, at the extreme, features one click purchases. Unfortunately applying for financial products requires many steps to satisfy Know Your Customer (KYC) regulations and comply with disclosure and fair practice requirements. You will likely never be able to apply for a checking account with one click. Clients on Andera’s legacy platform on average saw between 70-80% of applicants drop-off from start to submit, compared to an average of 60-70% in consumer retail checkout. In addition, around 10-30% of submitted, approved applicants never open accounts because they fail to complete the final few steps. Institutions should look at both numbers. The chart below shows application drop-off by page from start to submit, aggregated across 26 clients on the Andera Legacy online account opening platform.

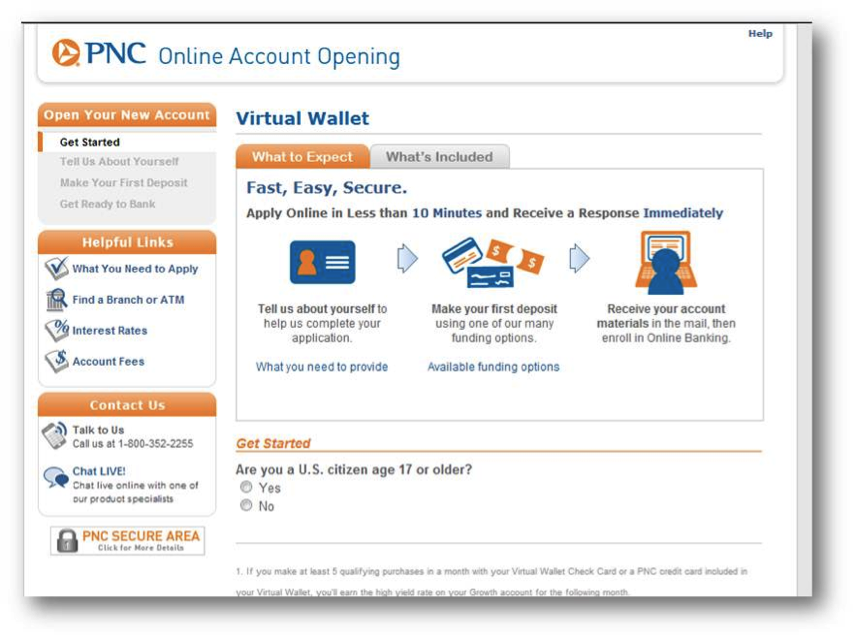
That said, there is a lot that financial institutions (or their vendors) can do to make account and loan applications a faster and easier process. When it comes to workflow design, a good user experience designer is worth his/her weight in gold. Things like page order, help text syntax, and field groupings and labels can make the difference between a completed application and a frustrated, confused, abandoner. PNC created a winning application for their virtual wallet product in 2010 by teaming up with IDEO’s expert designers and Andera. Our next generation platform, oFlows, is helping us make that type of experience available for all institutions.

Online account opening and lending can also create what I like to think of as ‘break downs.” Imagine that you’re test driving a luxury vehicle; the seats are roomy and comfortable, the steering is smooth, and the suspension is fantastic, so even though the road is bumpy, you don’t feel a thing. Then suddenly, the car breaks down, and you have to wait for three hours for a mechanic to come and fix it. Would you buy the car?
There are three main ways a deposit account or loan application can break down to spike abandonment rates:
- Identity Verification Failure: Data-based identity verification systems often can’t find matches for applicants with thin credit files, and around 10-20% of matched applicants fail the out-of-wallet questions required to confirm they are who they say they are. The best systems will use alternative data to reduce IDV failures, and for those who do fail, they will make it easy to upload a photo ID for manual review. Ally’s otherwise first-class ride broke down in this way.
- Challenge Deposit Wait Time: Financial institutions who allow funding via ACH often require applicants to verify their bank account with challenge or trial deposits. Unfortunately, challenge deposits don’t appear in the applicants bank account right away, and even if they did, verifying them would still require the applicant to navigate away from the application, login to a different system, locate the appropriate information, and return.
- Signature Card Mail or Fax Requirement: e-Signatures were legalized back in 2000, but many financial institutions still require applicants to fill out and mail in a “signature card” so they’ll have a copy of a physical signature on hand to compare to later checks. This is not a necessary step (many of our clients don’t require signature cards), and the cost (abandonment) is becoming less and less justifiable as check use continues to decline. Read more here.

The three causes of “break down” and high abandonment rates are not easy to eliminate. Solving the IDV problem usually requires additional investment from the institution, either in alternative data integration or a solution that easily allows photo upload. ACH funding is cheaper for institutions than credit/debit funding, and less vulnerable to certain types of fraud. As noted, physical signatures can also help reduce the risk of fraud. We believe that in all three cases, the incremental risk or investment isn’t worth losing applicants to abandonment.
It’s difficult to compare abandonment rates across institutions, because every institution attracts slightly different applicants and every institution has slightly different products. But abandonment is definitely something that financial institutions need to pay attention to. A small decrease in abandonment can mean hundreds of new customers or members a year. For more on abandonment, check out Andera’s report on the “7 Reasons Applicants Quit.”
3) Cross-Sell Rate
The third important metric is the cross-sell rate.
Online account opening and lending has made it easier for banks and credit unions to acquire new customers and members, but it also has made it easier to lose them. Open a checking account for a consumer, and they don’t have much incentive to stick around. Annoy a savvy online shopper once, and he or she can switch institutions in about half an hour from their dining room table. Open a checking account and a seven-year CD for a consumer,and bam, that relationship just got a whole lot stickier.
A good online application will incorporate an automated cross-sell step that presents applicants with pre-approved offers for deposit and loan products, and allow applicants to apply for all products they select using a single application. Andera’s oFlows platform makes cross-sell offers as early as possible, to increase the likelihood that applicants will consider and accept the offer (towards the end of the process applicants have less patience, and may misunderstand the offer, thinking that it will require them to start a new application).
The paradox of choice also applies to cross-sell offers. Applicants usually aren’t looking to take out a new auto loan, refinance their mortgage, and open five different types of savings accounts the first time they apply, and presenting offers for all of those products might overwhelm them. (Bank of America is an offender on this point). Our clients have found great success with targeted offers for one or two products, usually a savings account and/or a credit card.

4) User Experience
The fourth metric is not a concrete metric like conversion, abandonment, and cross-sell. It’s not something that you can calculate and report on monthly for your executive board. But of the four, it’s probably the most important.
For customers and members acquired through the online channel, your website and application are the first impression of your financial institution. It doesn’t matter how friendly, concerned, and helpful your staff are, or how accessible and comfortable your branches are, or even how great your rates are; if new customers/members have a terrible user experience opening an account, they’ll start off with a terrible opinion of your bank.
Innovative new institutions that offer “neo-checking” accounts, as Ron Shevlin calls them, can’t compete with established institutions on product variety, branch network, or raw manpower. But because of careful attention to the details and an emphasis on user-centric design, they’ve created thousands of brand advocates who spread their praise through established media, through blogs, twitter and facebook, and through good old-fashioned word of mouth.
Listen to what your customers and members are saying about your institution. Survey them on their experiences online to learn what you can do better. Make sure someone at your institution owns the user experience, and invest in new personnel if necessary. Banking is changing, and at the end of the day, user experience will matter most.
Bank and credit union marketing has come a long way in the last few years, but we still see too many institutions who are stuck in 3-6-3 thinking and expect new customers to just walk in the door. To succeed in an increasingly competitive environment, banks and credit unions need to become savvy online marketers, and focus on the metrics that matter. In this post I have focused on the subset of the funnel from site visit to submit, and not on activities further up, including institution brand awareness and total website traffic, or further down, including application approval rate.
For more tips on optimizing the online channel, check out Andera's free webinars and whitepapers as well as additional posts on The Andera Blog.
Conclusion
For more tips on optimizing the online channel, check out Andera's free webinars and whitepapers as well as additional posts on The Andera Blog.
About the Author

Melanie Friedrichs is an analyst for Andera, Inc, is the leading provider of online account opening and lending solutions for banks and credit unions in the US. Melanie is a 2012 Venture for America fellow and a graduate of Brown University. She writes about innovation and marketing in retail banking for The Andera Blog, and contributes posts to Bank Innovation and BankNXT. Melanie is based in Providence, Rhode Island.


